Put it on the wall.
100 infographics on Lean, Operations and Leadership. Each one explains a concept on a single sheet, ready to print up to A0.
 Lean Foundations
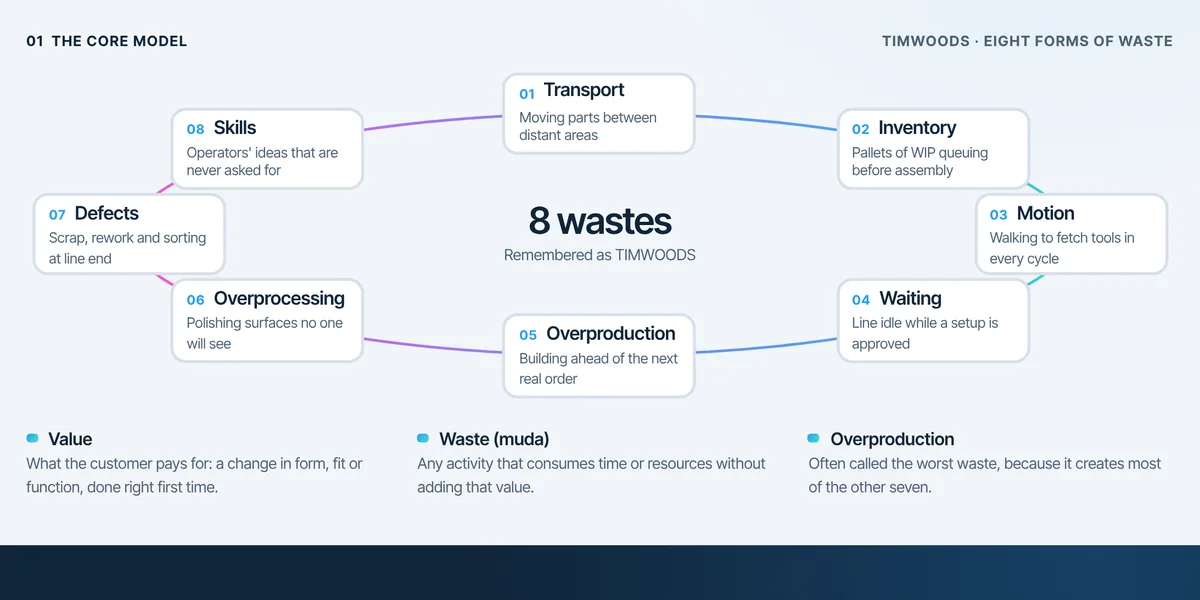
The 8 Wastes of Lean
Waste (muda) is any activity that uses time, space or resources without adding value the customer is willing to pay for.
 Lean Foundations
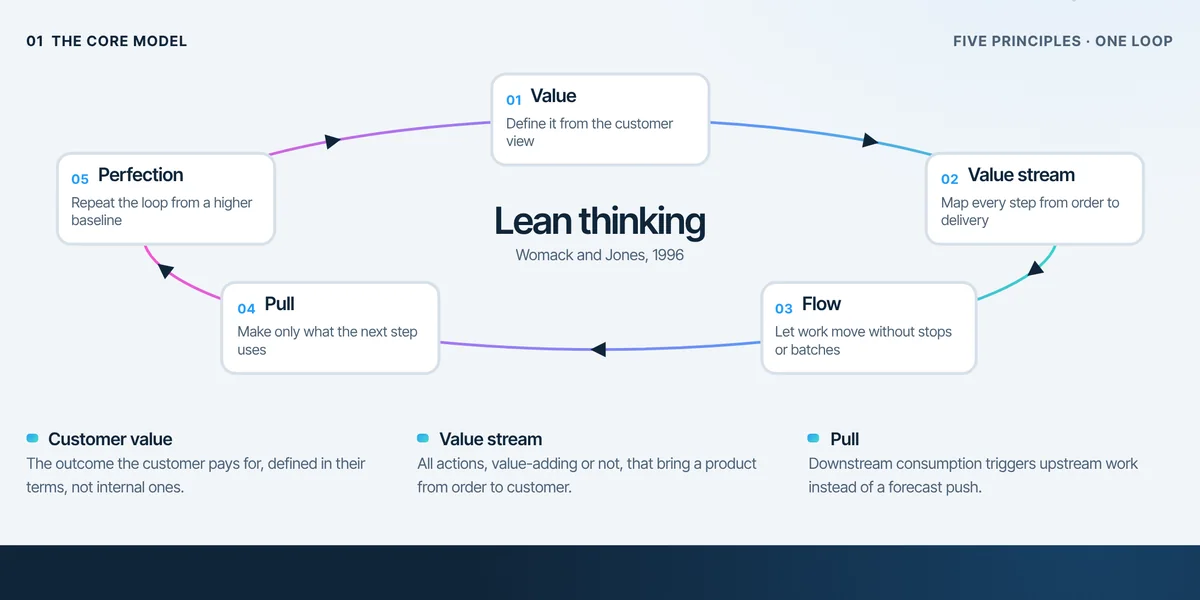
The Five Principles of Lean
Lean thinking turns customer value into a continuous loop: define value, map how it is created, make it flow, let the customer pull it and keep improving toward perfection.
 Lean Foundations
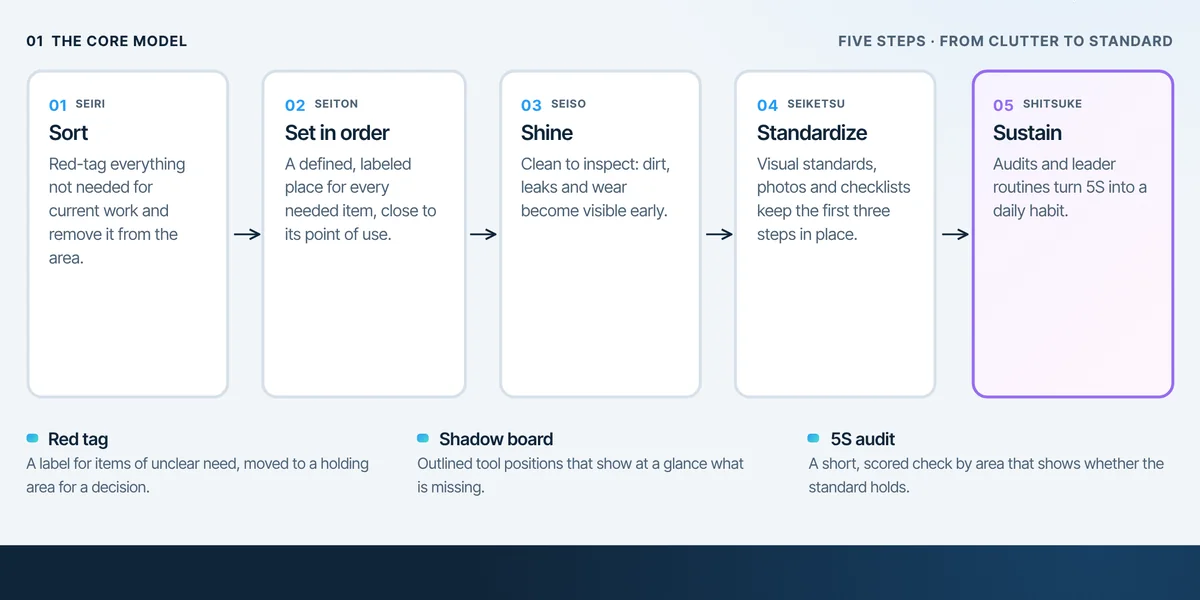
5S Workplace Organization
5S is a five-step method to create and keep a clean, orderly and visual workplace, so that abnormalities become obvious and standard work becomes possible.
 Lean Foundations
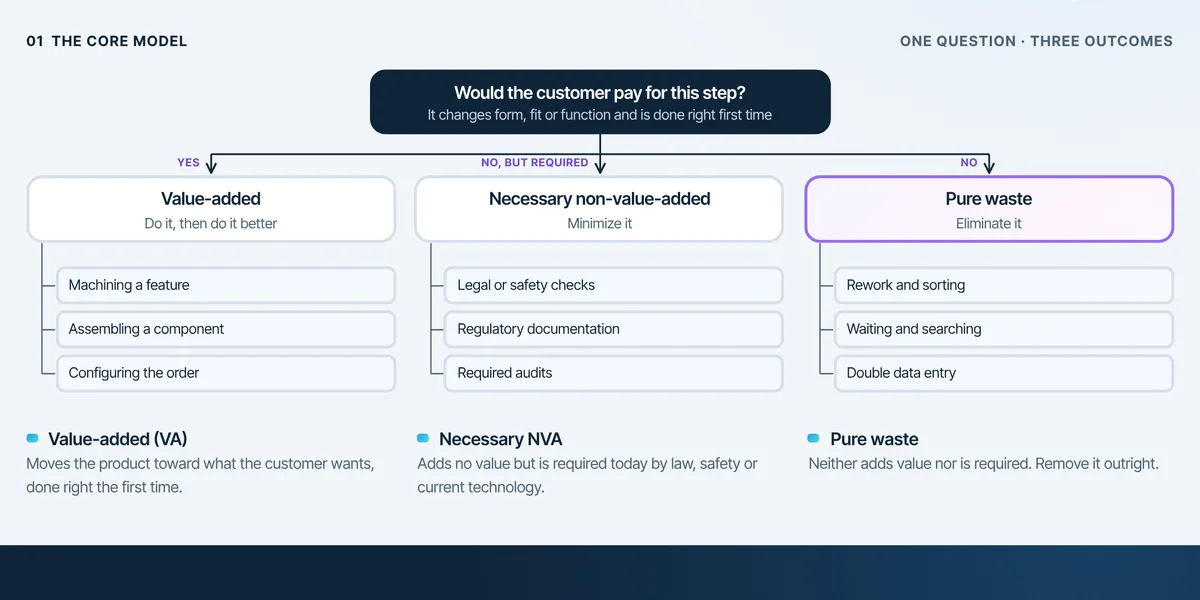
Value-Added vs Non-Value-Added Work
Every step in a process is either value-added, necessary but non-value-added, or pure waste.
 Lean Foundations
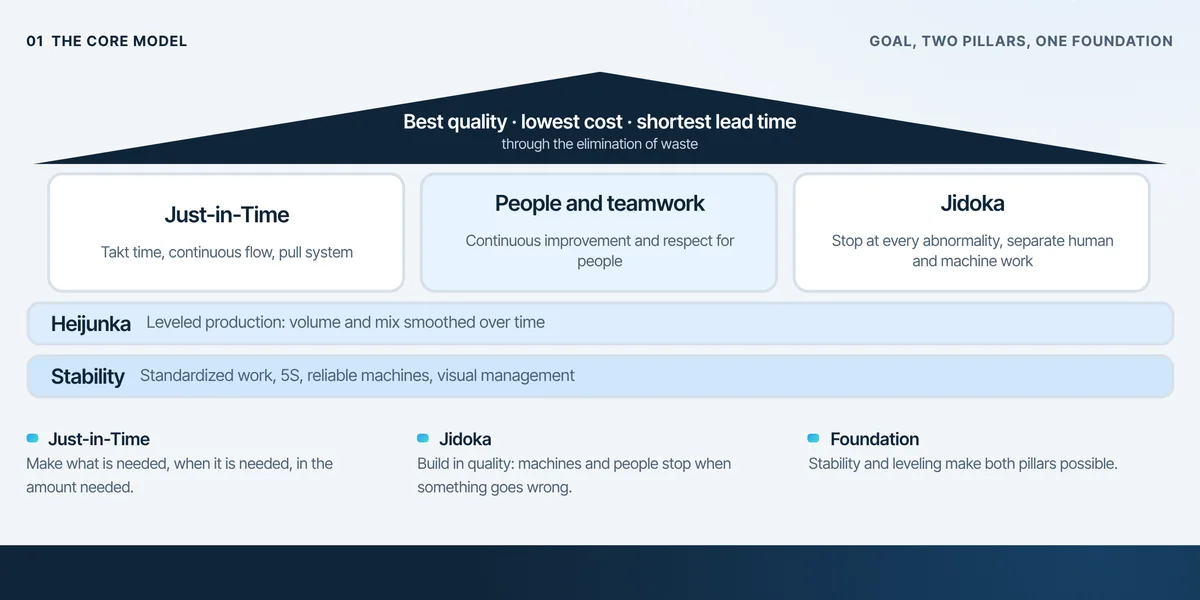
The House of Toyota Production System
The TPS house shows how Toyota reaches its goals: two pillars, Just-in-Time and Jidoka, rest on a foundation of stability and leveling, with people and improvement at the center.
 Lean Foundations
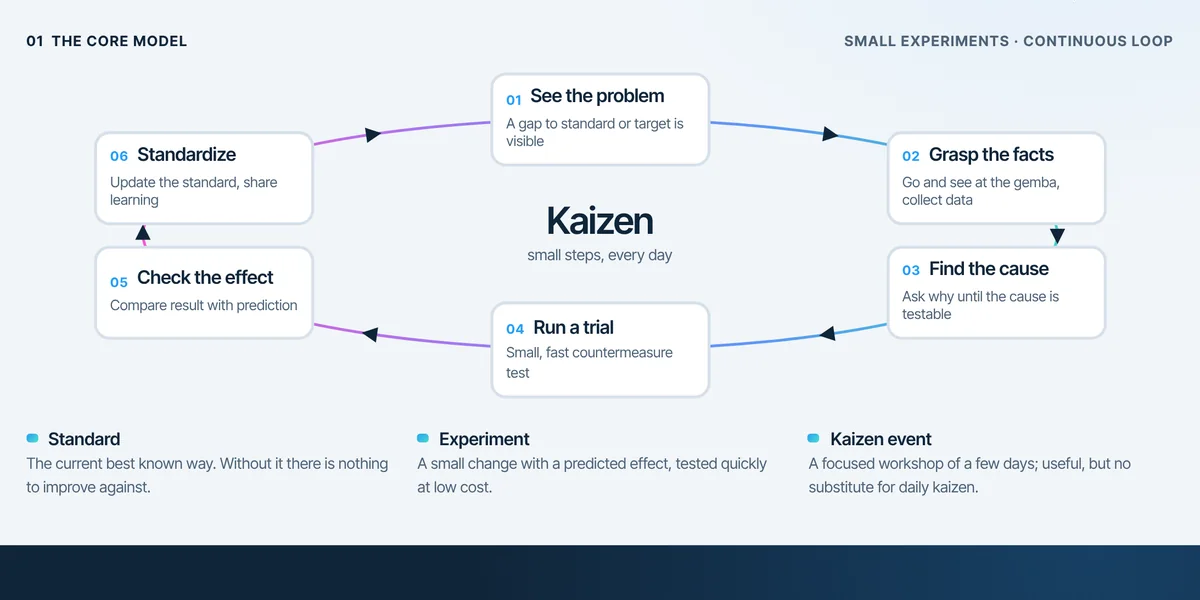
Kaizen: Continuous Improvement
Kaizen means change for the better: many small, fast experiments run by the people doing the work, each one ending in a new standard.
 Lean Foundations
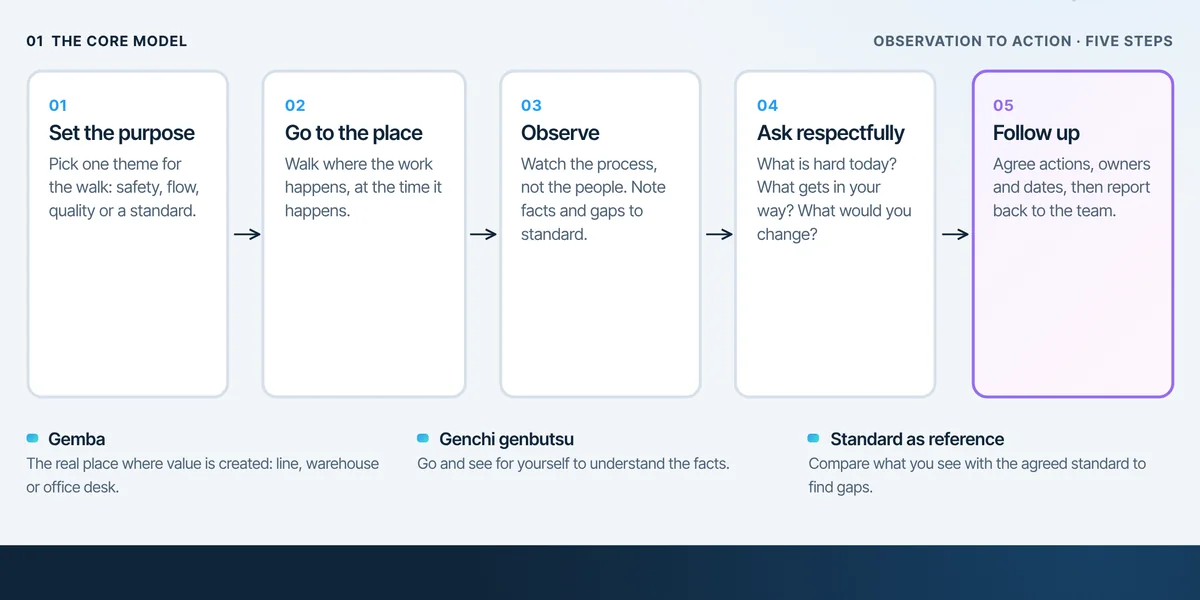
Gemba Walk: Go See Learn Act
A gemba walk takes leaders to the place where work happens to observe the process, ask respectful questions and follow up on what they learn.
 Lean Foundations
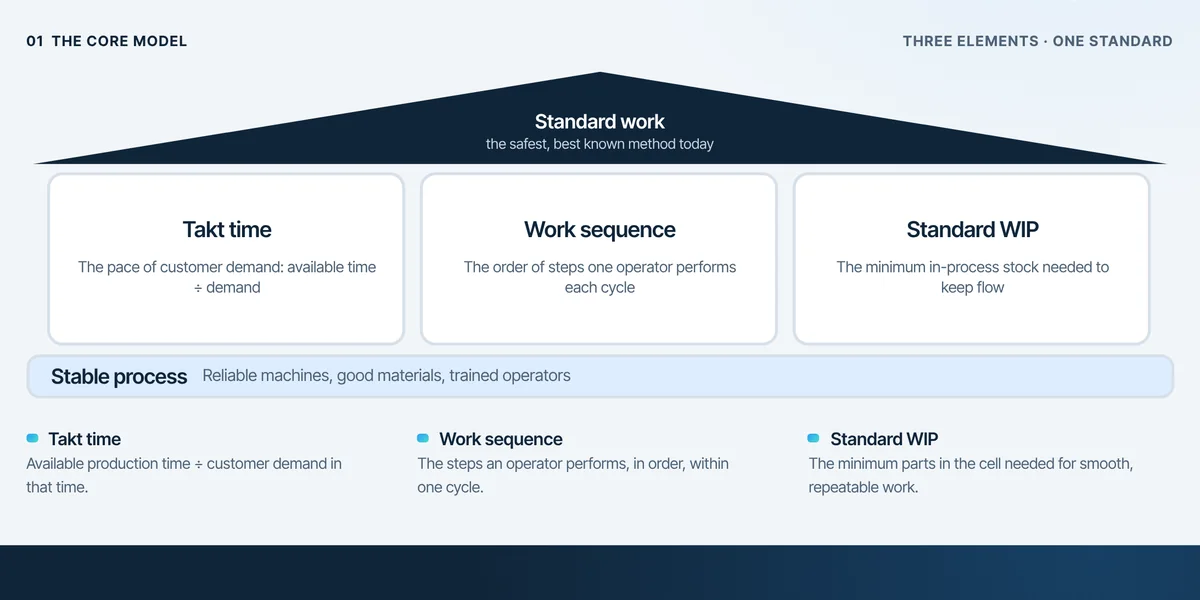
Standard Work Fundamentals
Standard work documents the safest, best known way to do a job today.
 Lean Foundations
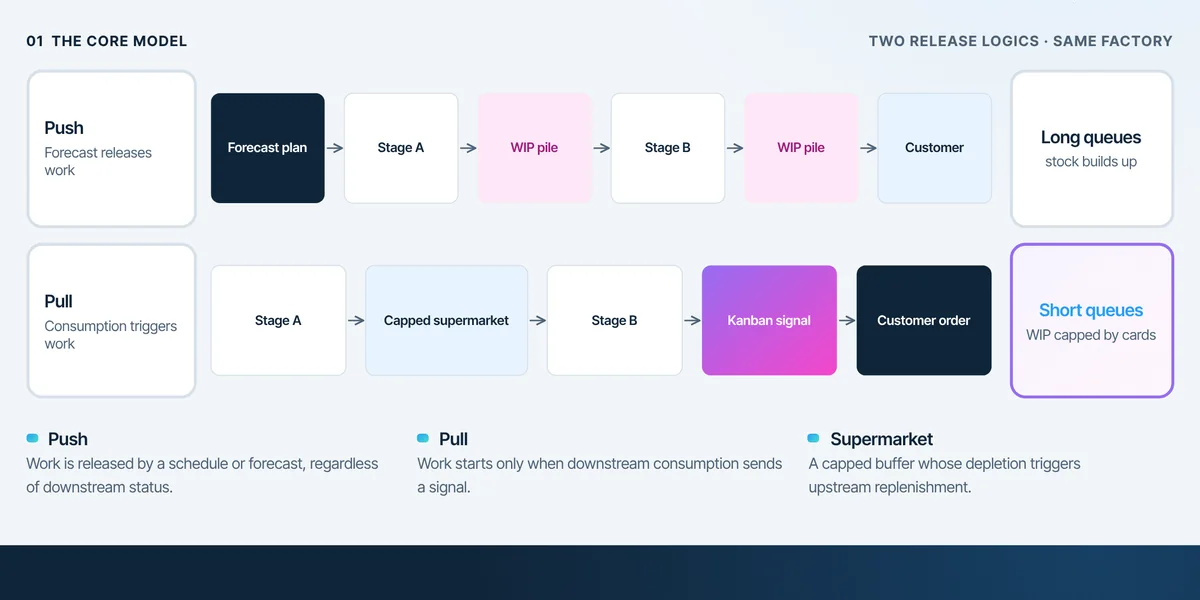
Push vs Pull Systems
Push releases work by forecast or schedule, while pull starts work only when downstream consumption signals a real need.
 Lean Foundations
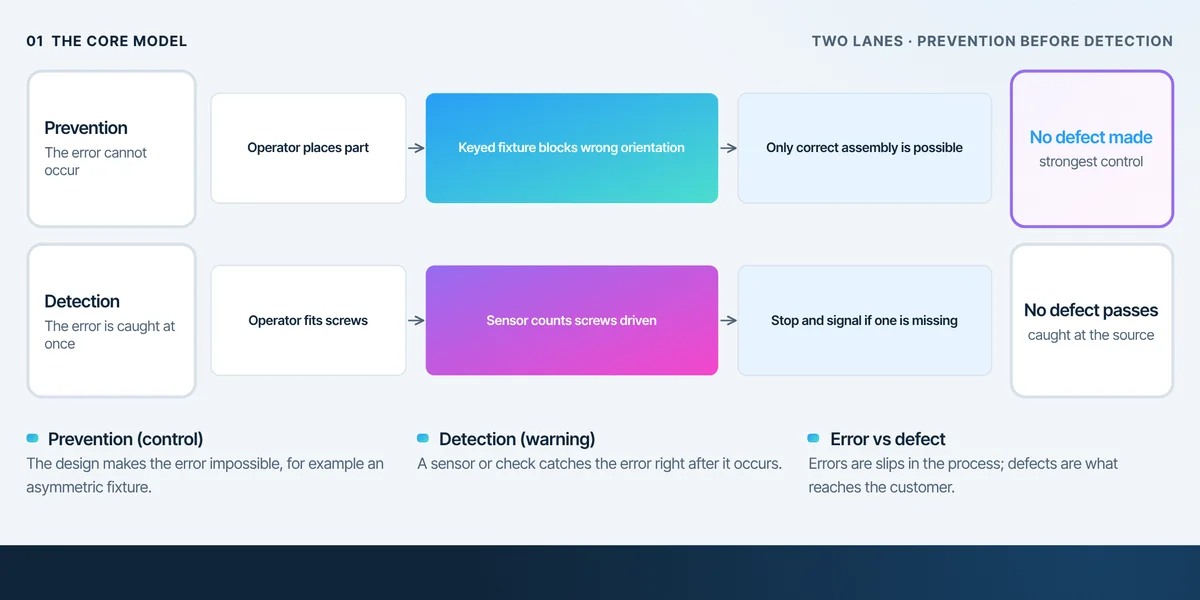
Poka-Yoke: Mistake Proofing
Poka-yoke is a simple device or design feature that prevents an error from happening, or detects it immediately, before it becomes a defect.
 Operational Excellence
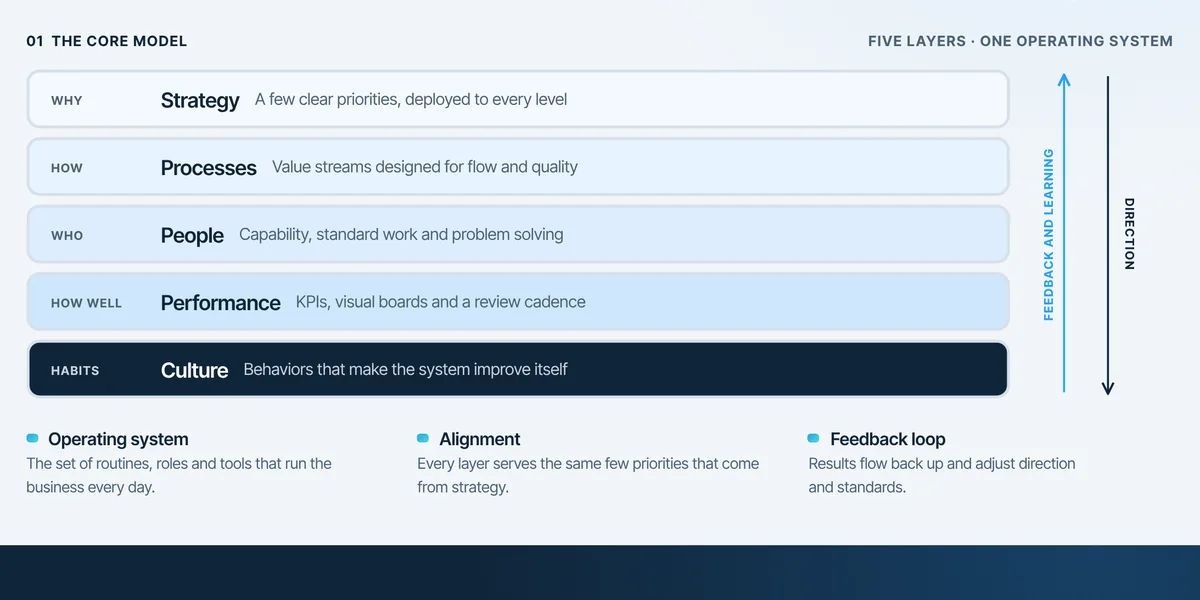
The Operational Excellence System
Operational excellence is a management system in which strategy, processes, people, performance routines and culture are linked, so that results improve every day and hold over time.
 Operational Excellence
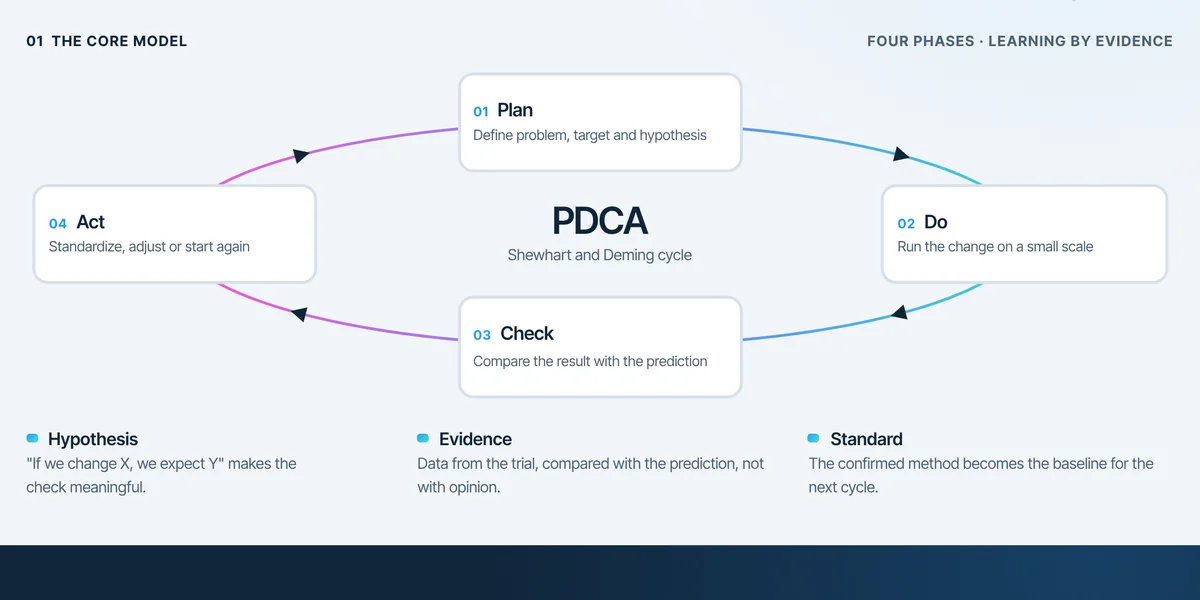
PDCA: The Improvement Engine
PDCA is a four-step learning cycle: plan a change with a clear prediction, do it on a small scale, check the result against the prediction and act on what you learned.
 Operational Excellence
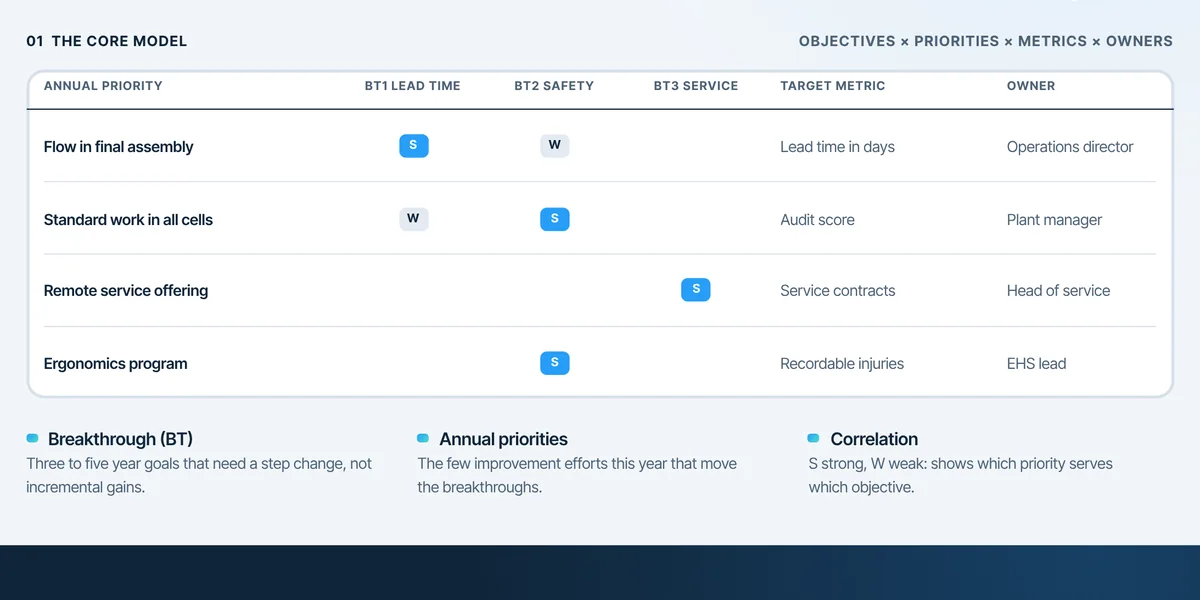
Hoshin Kanri X-Matrix
The X-matrix is a one-page Hoshin Kanri tool that links long-term breakthrough objectives to annual priorities, metrics and owners, and shows how strongly each one supports the others.
 Operational Excellence
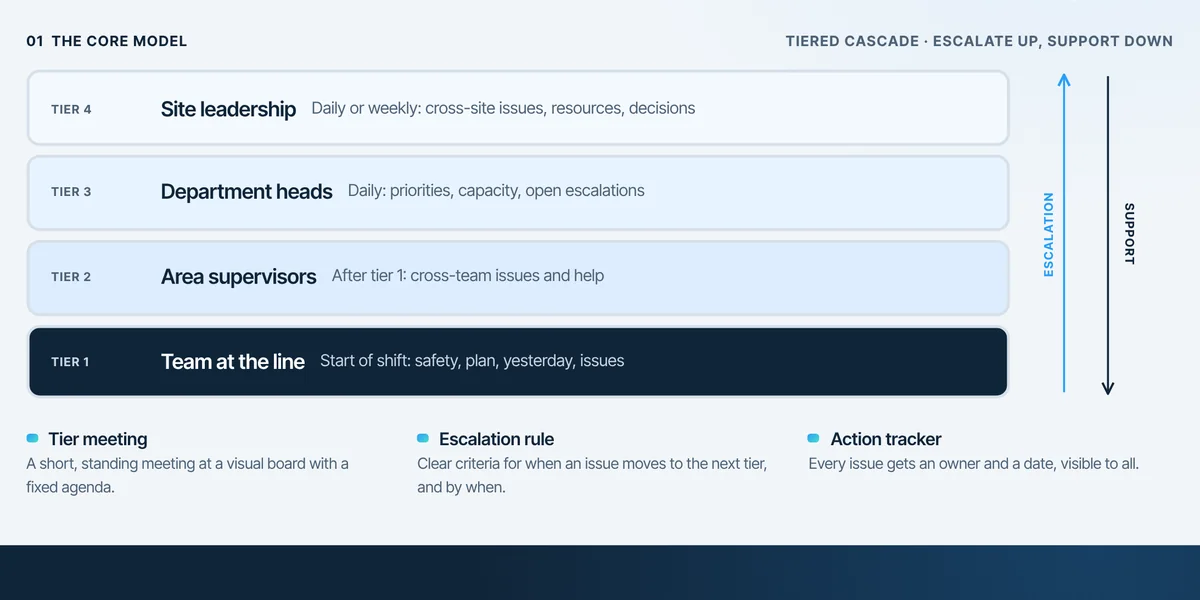
Daily Management System
A daily management system is a cascade of short, tiered meetings at visual boards that brings problems to the level that can solve them, the same day.
 Operational Excellence
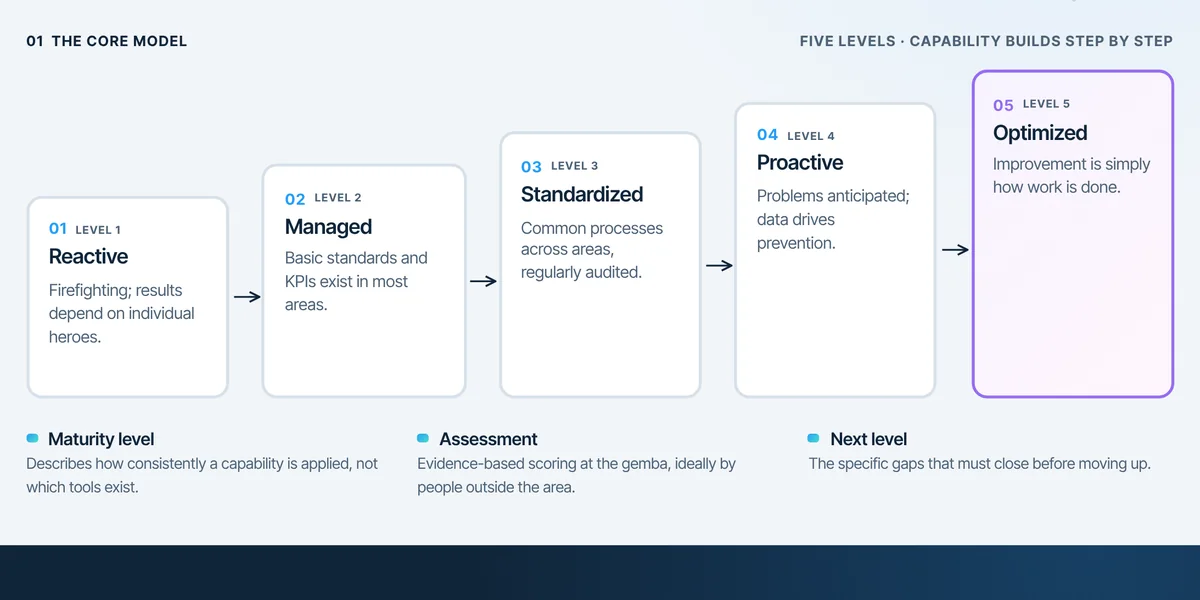
Operational Maturity Model
An operational maturity model describes how consistently a capability is applied, in levels from reactive firefighting to self-improving, so a site can see where it stands and what comes next.
 Operational Excellence
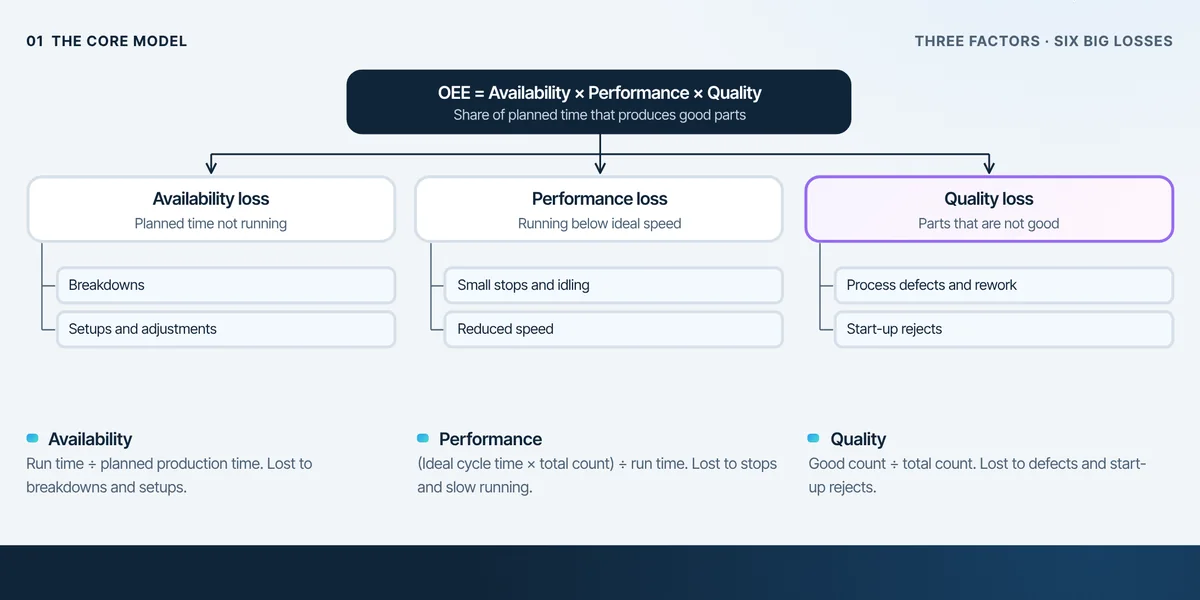
The OEE Loss Tree
OEE shows how much planned production time is truly productive, and its loss tree splits the gap into six big losses.
 Operational Excellence
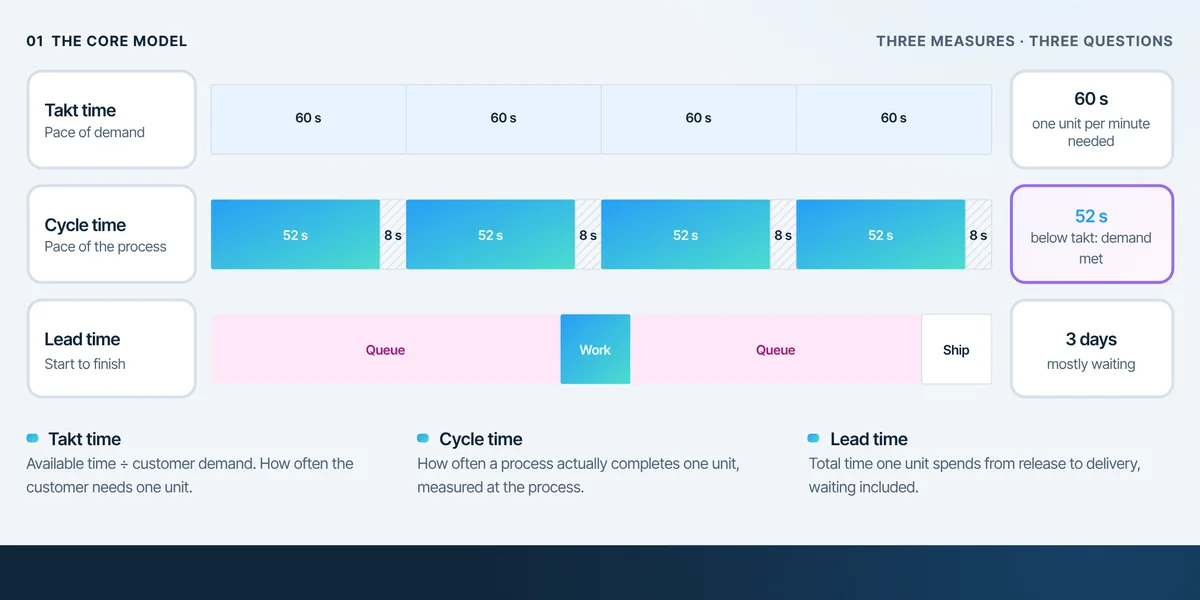
Takt Time vs Cycle Time vs Lead Time
Takt time is the pace the customer demands, cycle time is the pace a process actually achieves and lead time is how long one unit spends in the system from start to finish.
 Operational Excellence
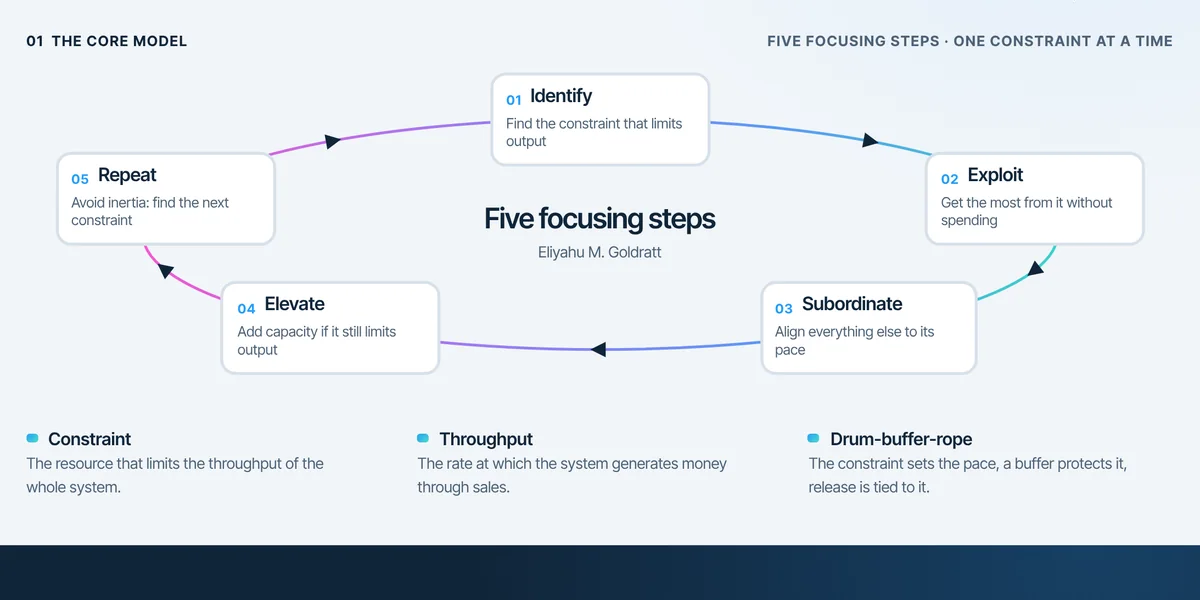
Theory of Constraints Five Focusing Steps
The Theory of Constraints focuses all improvement on the one constraint that limits the output of the whole system.
 Operational Excellence
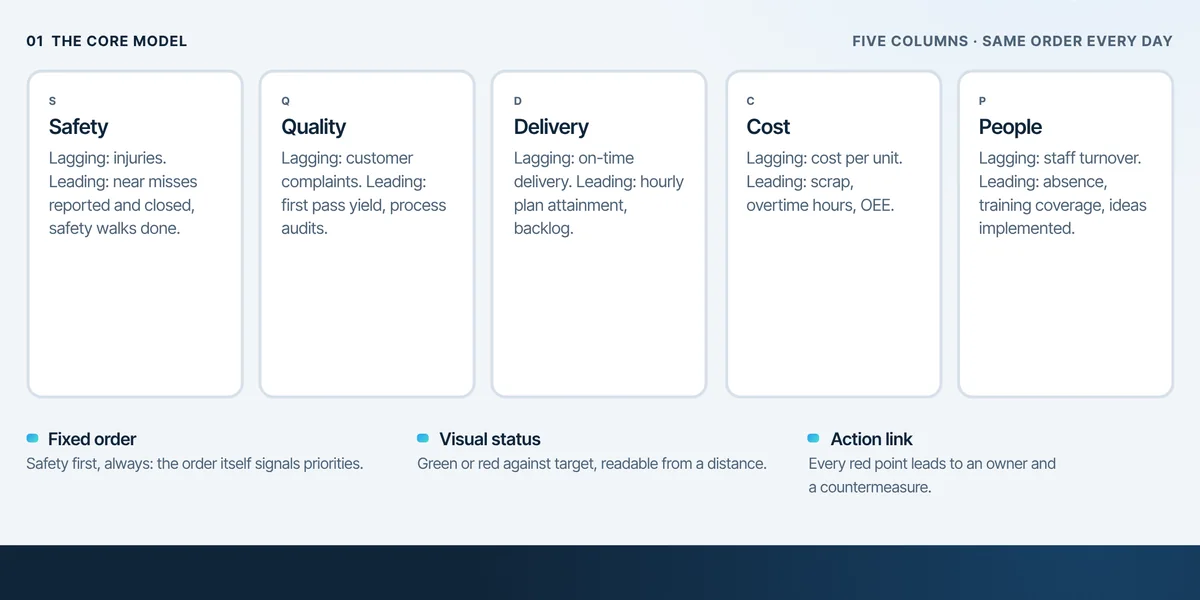
SQDCP Performance Management
SQDCP organizes daily performance into five fixed categories, Safety, Quality, Delivery, Cost and People, so every team reviews the same essentials in the same order.
 Operational Excellence
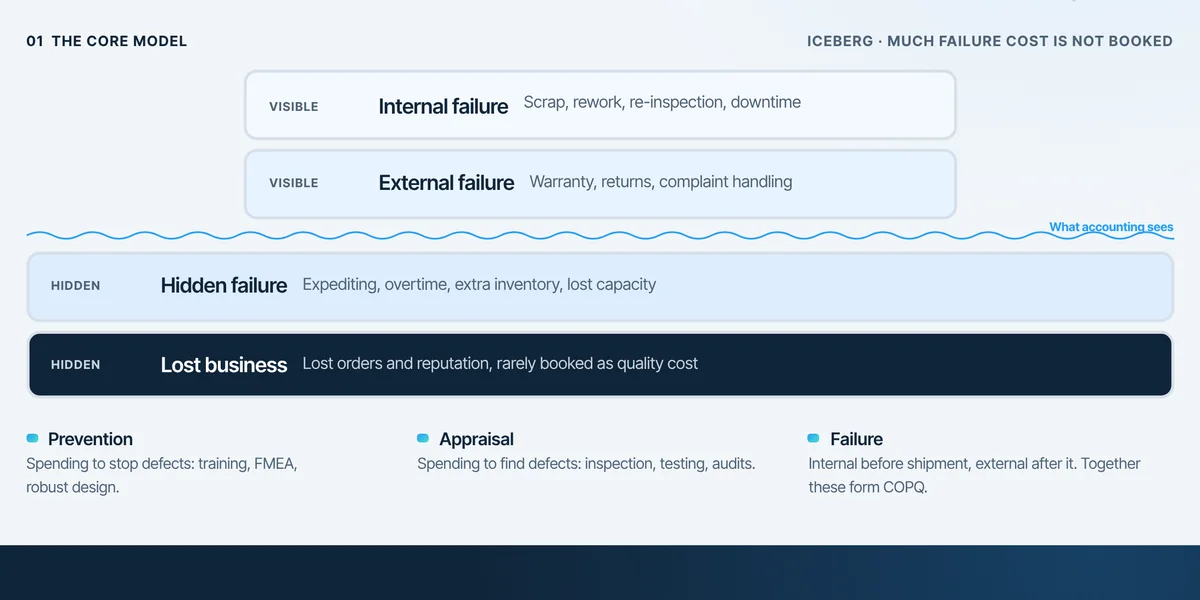
Cost of Poor Quality
The cost of poor quality (COPQ) is everything an organization spends because work was not done right the first time, from scrap and rework to warranty claims and lost customers.
 Production & Manufacturing
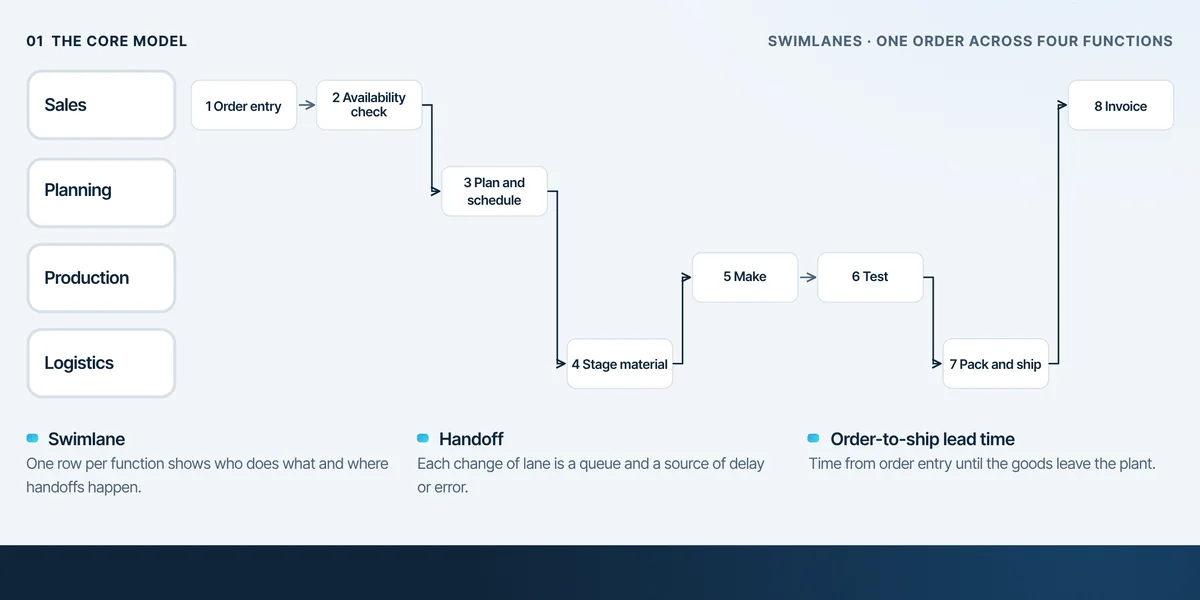
From Order to Shipment
Order-to-shipment is the end-to-end path a customer order takes through sales, planning, production and logistics until the goods leave the plant.
 Production & Manufacturing
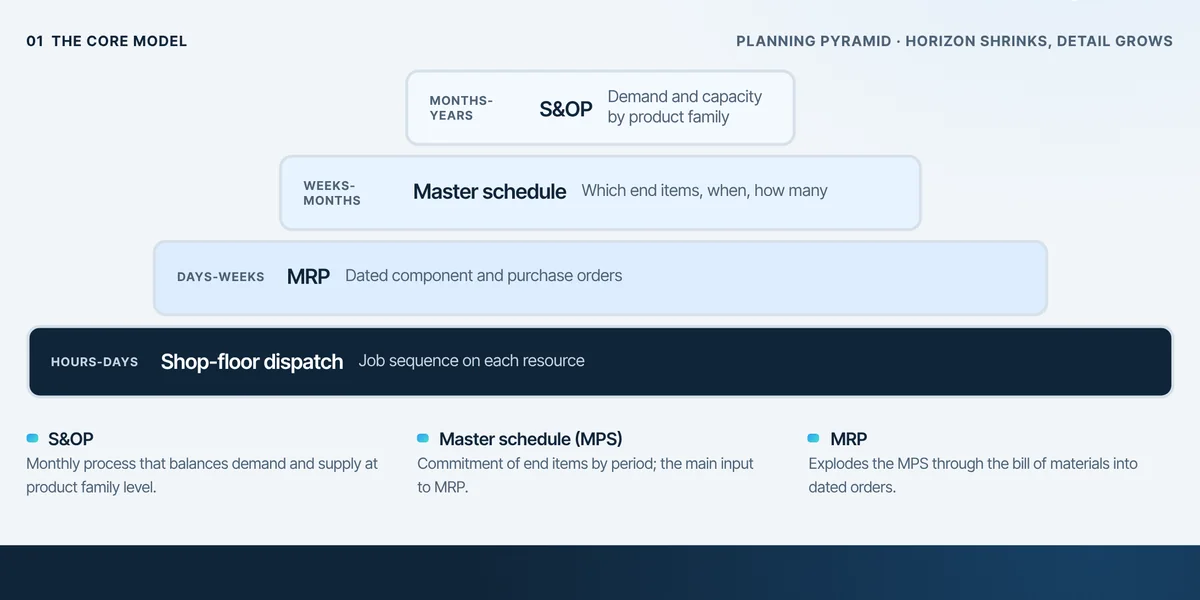
Production Planning Hierarchy
Production planning works in levels: each level plans a shorter horizon in more detail, from sales and operations planning down to the job sequence on the shop floor.
 Production & Manufacturing
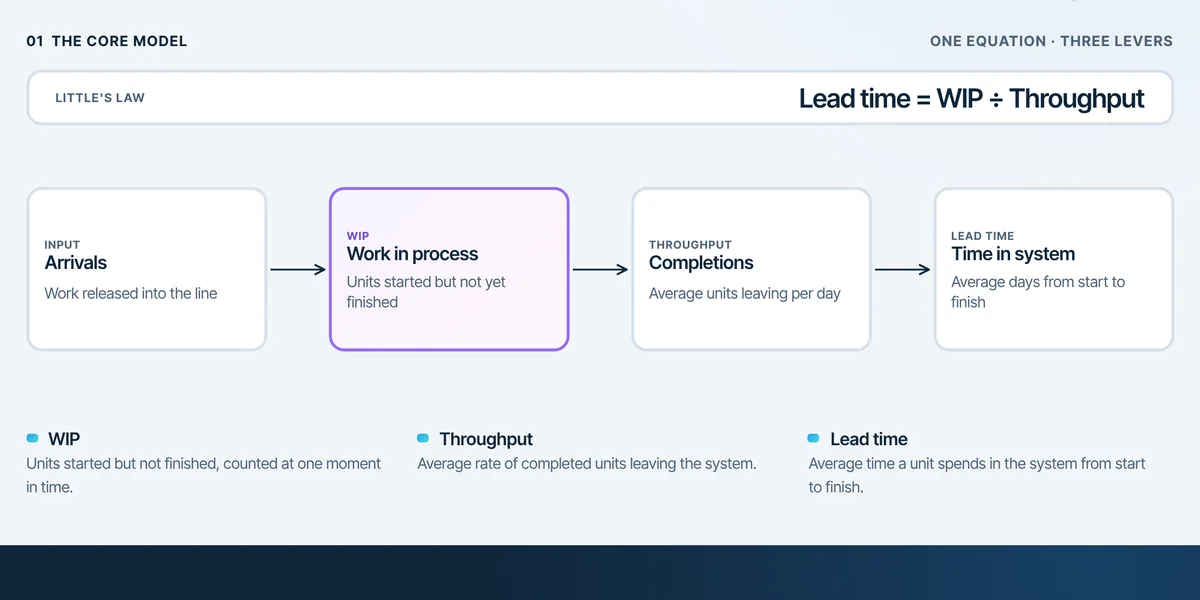
Little's Law in Manufacturing
Little's Law links three measures of any stable system: average work in process equals average throughput times average lead time.
 Production & Manufacturing
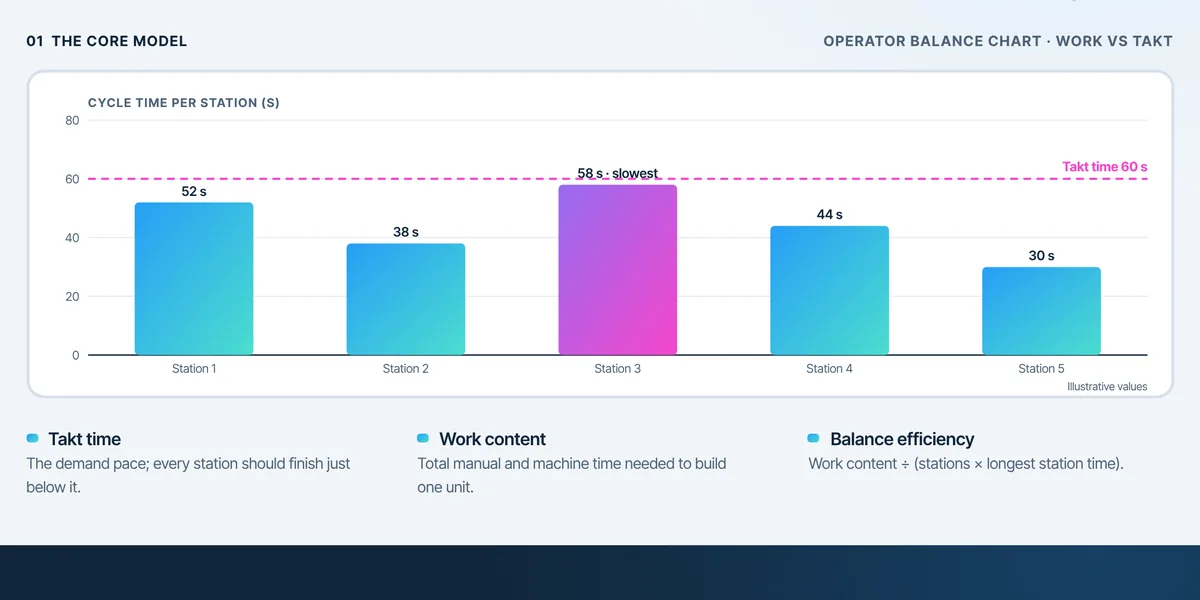
Line Balancing Explained
Line balancing distributes work across stations so each one finishes just below takt time, removing idle time and the overload that limits the line.
 Production & Manufacturing
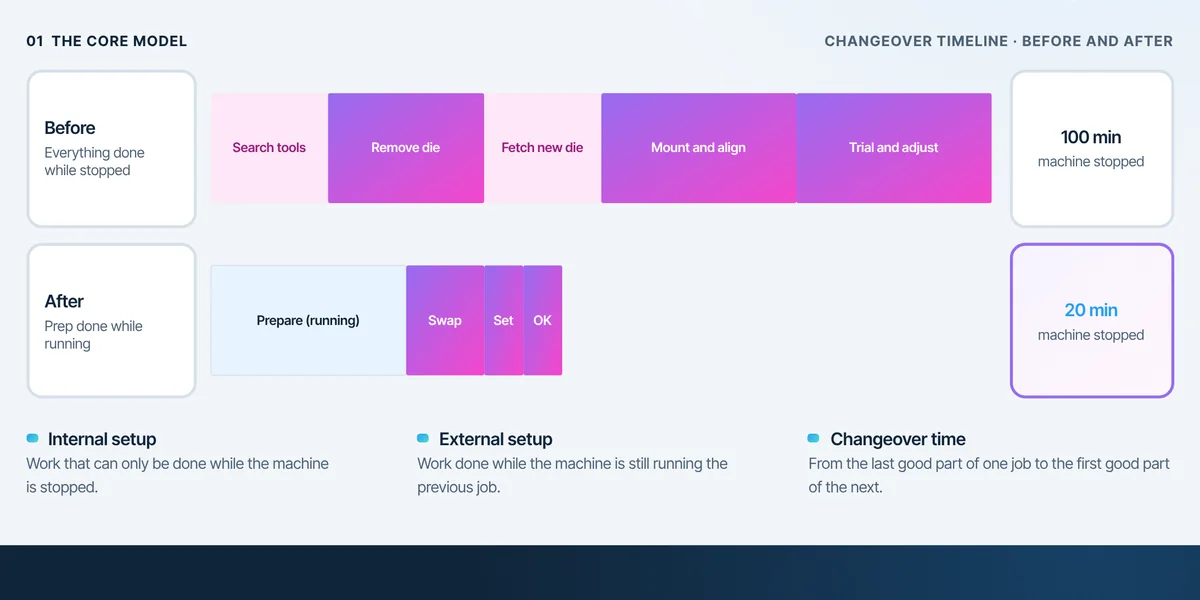
SMED: Reduce Changeover Time
SMED (single-minute exchange of die) cuts changeover time by moving setup work outside machine downtime and simplifying what must still be done while the machine stands.
 Production & Manufacturing
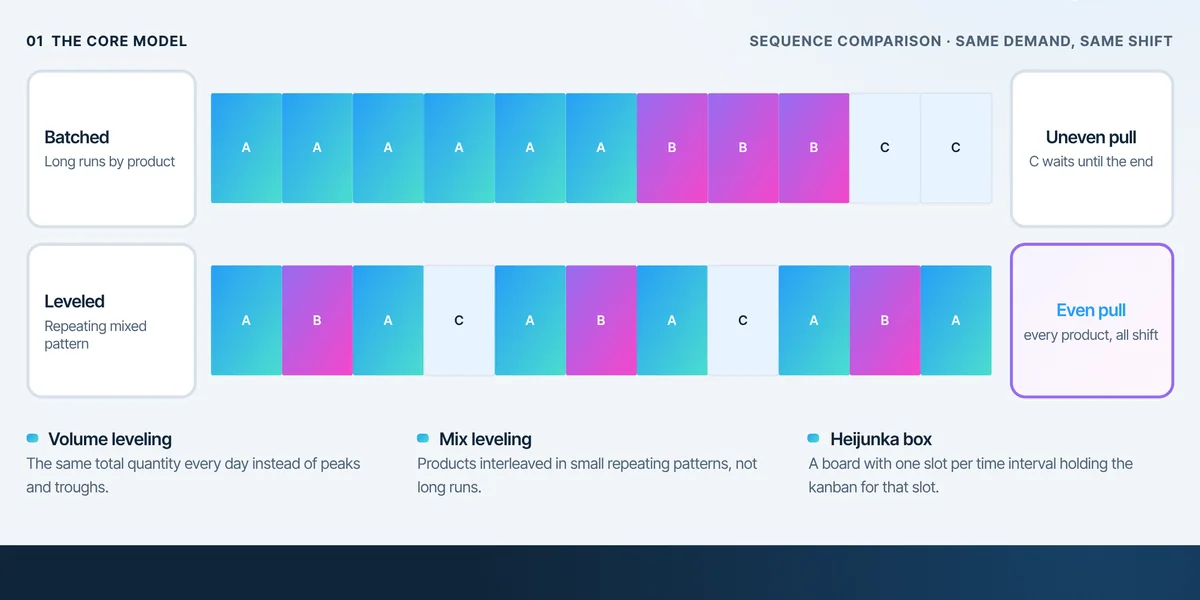
Heijunka: Production Leveling
Heijunka levels production by volume and by mix, so that upstream processes see a steady, predictable demand instead of large, irregular batches.
 Production & Manufacturing
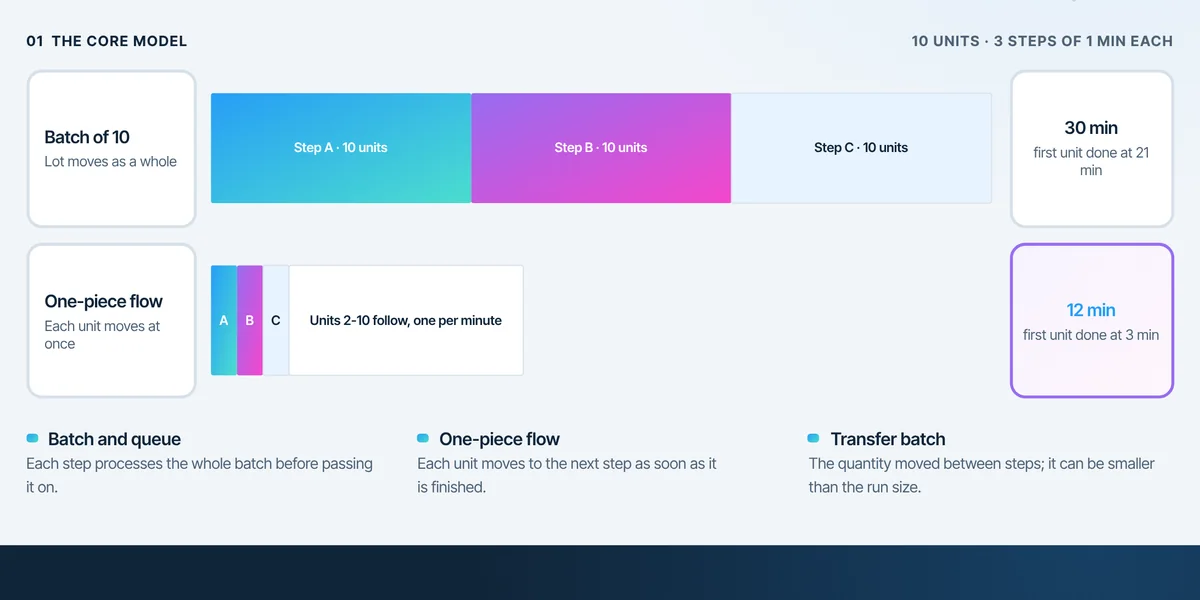
One-Piece Flow vs Batch Production
Batch production moves whole lots between steps, while one-piece flow moves each unit on as soon as it is done.
 Production & Manufacturing
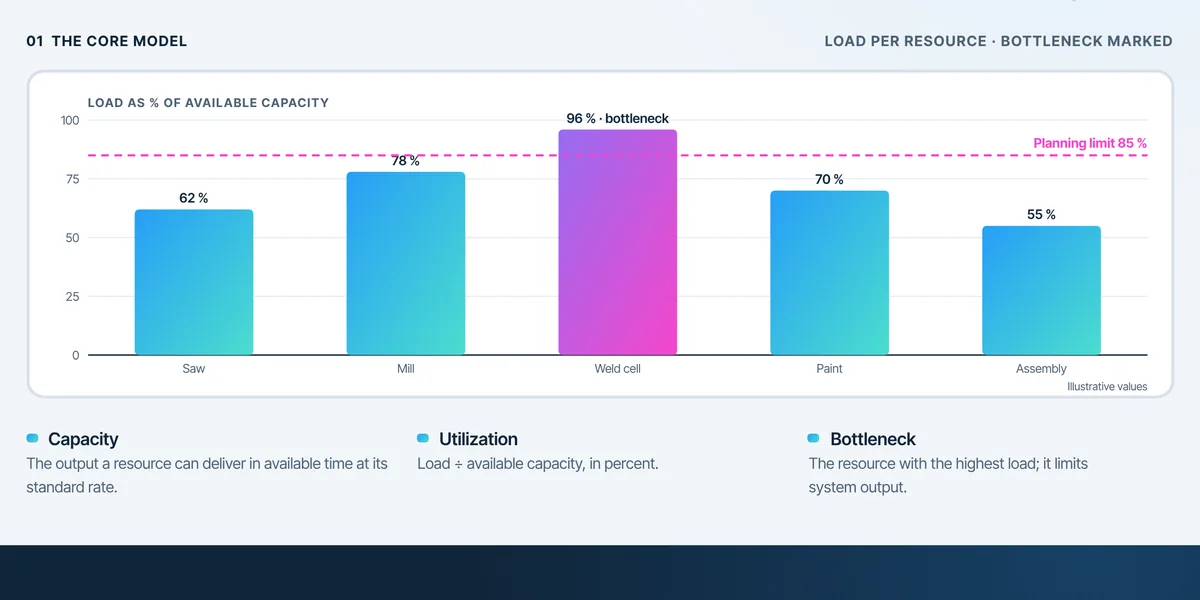
Capacity vs Utilization
Capacity is what a resource can produce, utilization is how much of it is loaded, and the most loaded resource is the bottleneck.
 Production & Manufacturing
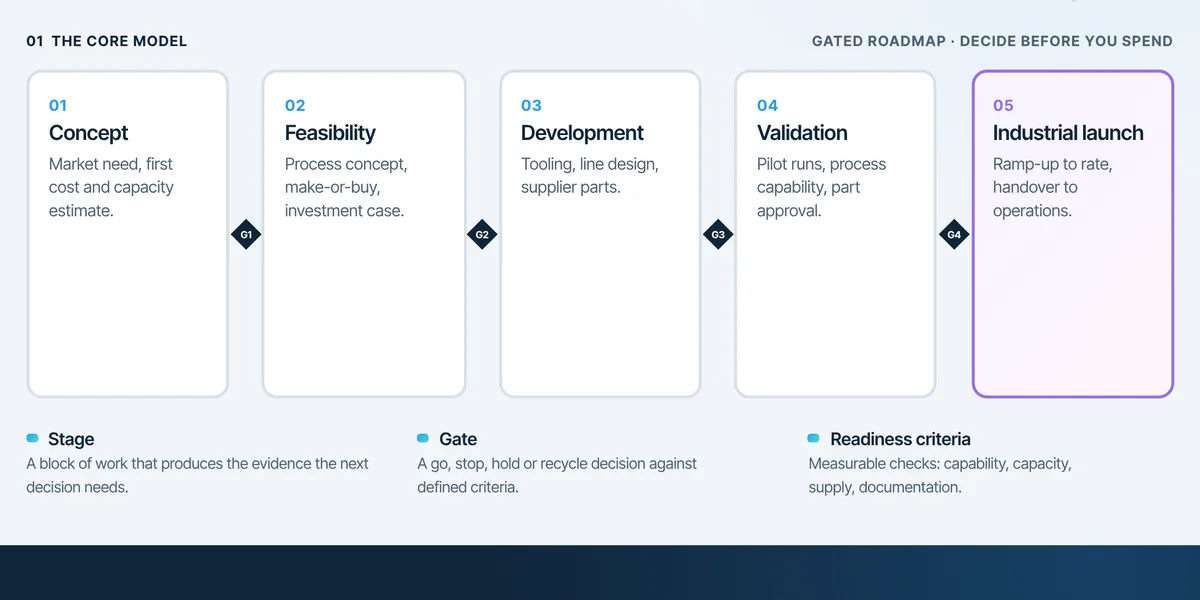
Manufacturing Stage-Gate Process
A stage-gate process moves a new product or process to industrial launch in stages, with a formal go, hold or stop decision at each gate based on defined readiness criteria.
 Production & Manufacturing
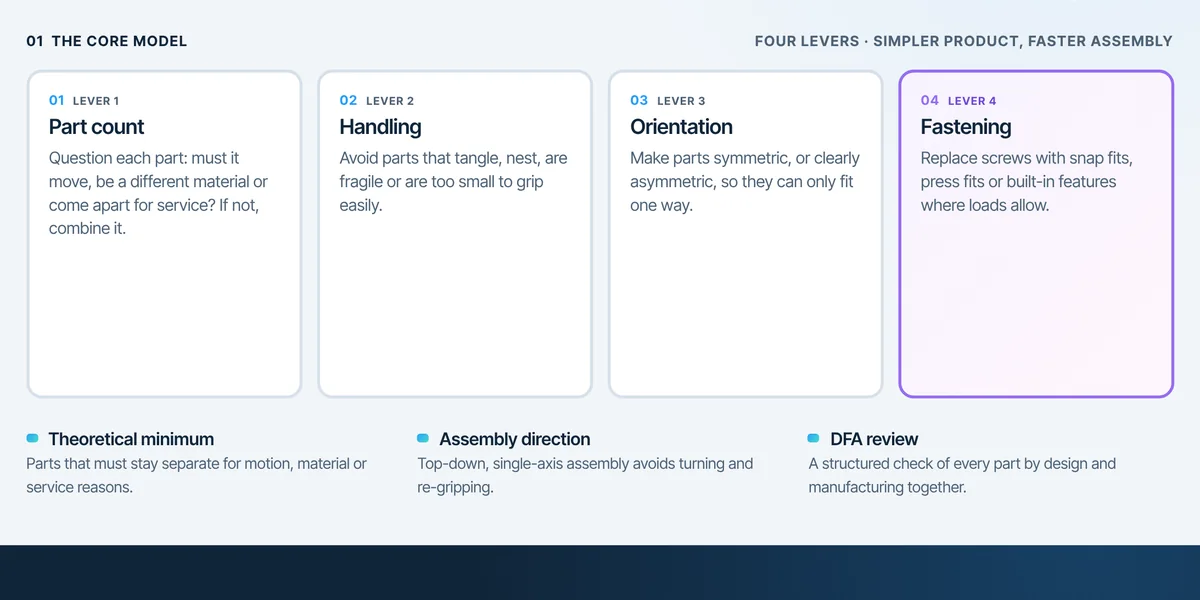
Design for Assembly
Design for assembly (DFA) simplifies a product so it is easy to put together: fewer parts, easy handling, one-way orientation and simple fastening.
 Quality Management
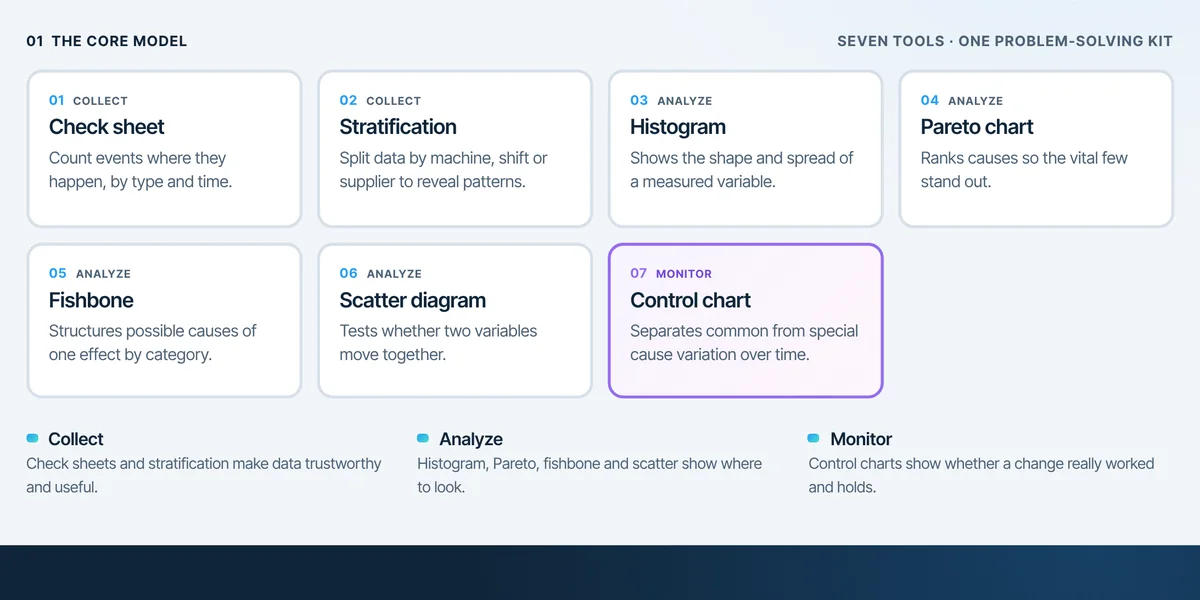
The Seven Basic Quality Tools
The seven basic quality tools are simple graphical methods that let any team collect, analyze and monitor data to solve most everyday quality problems.
 Quality Management
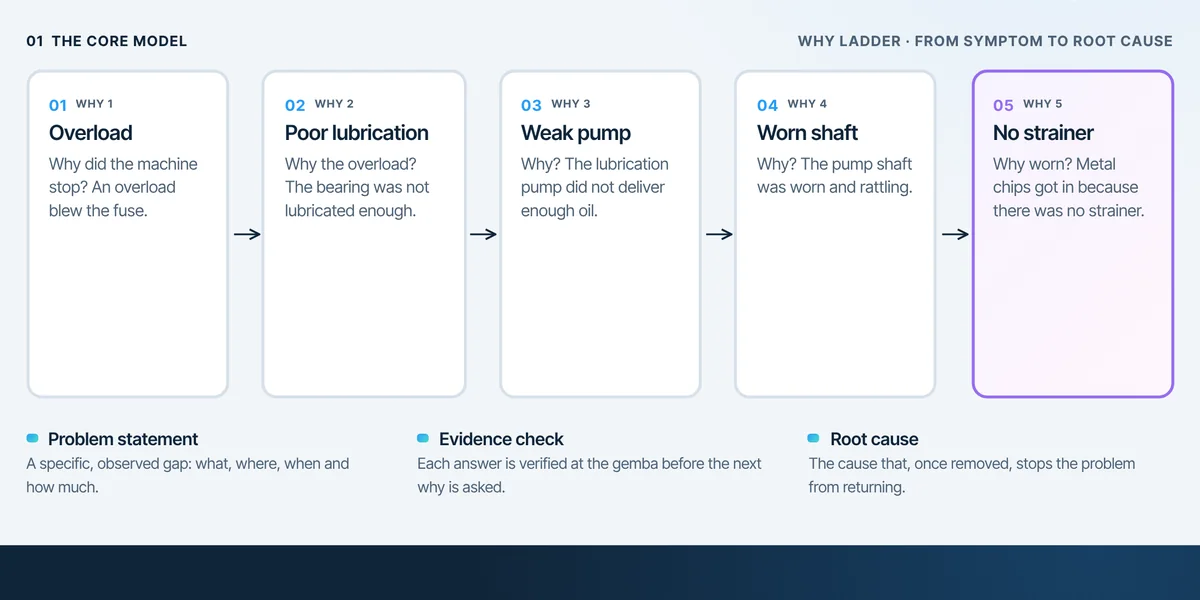
Root Cause Analysis: 5 Whys
The 5 Whys is a simple root cause method: ask why a problem occurred, verify the answer, and repeat until you reach a cause that, once removed, stops the problem from returning.
 Quality Management
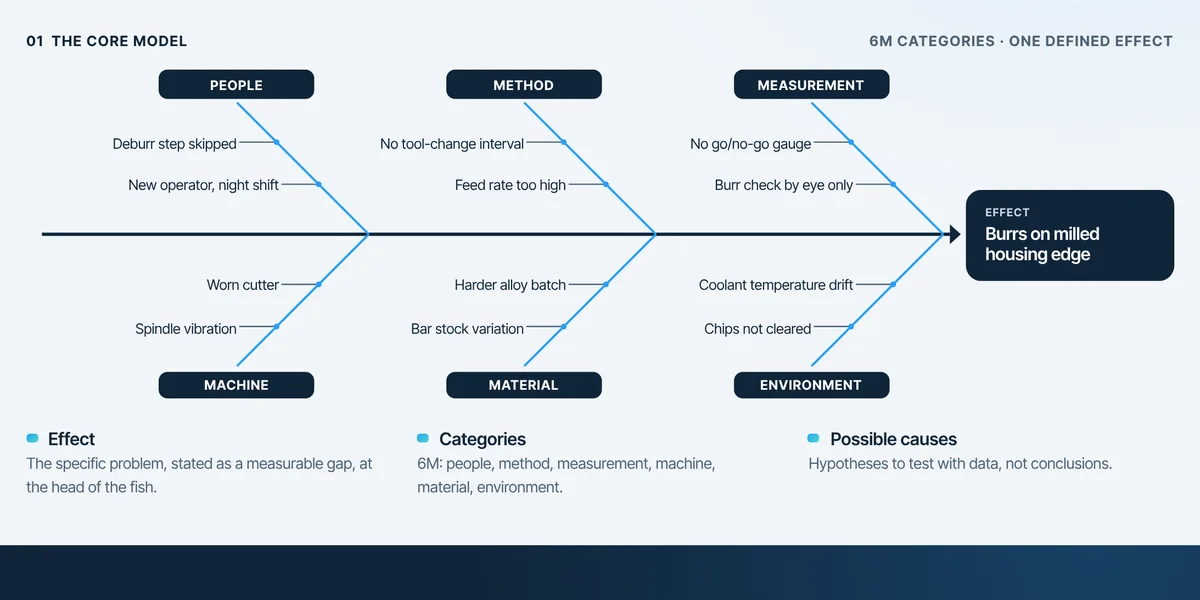
Ishikawa Fishbone Diagram
The Ishikawa or fishbone diagram arranges the possible causes of one clearly defined effect into categories, so a team can explore them systematically before testing them.
 Quality Management
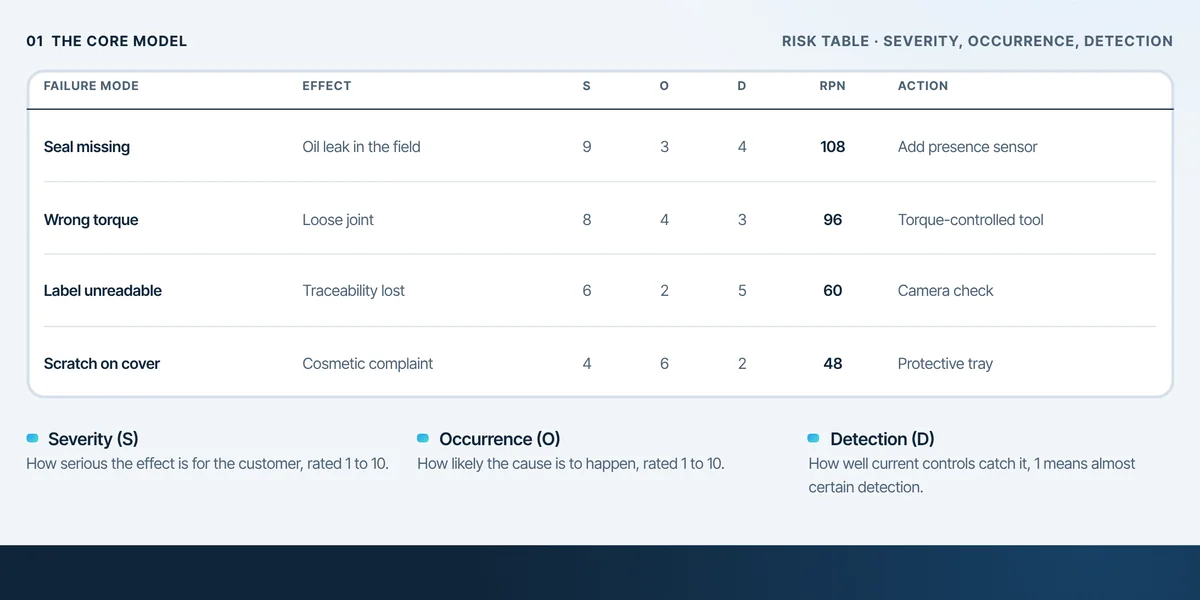
FMEA Risk Prioritization
Failure mode and effects analysis (FMEA) lists how a product or process could fail, rates each failure for severity, occurrence and detection, and drives actions on the highest risks.
 Quality Management
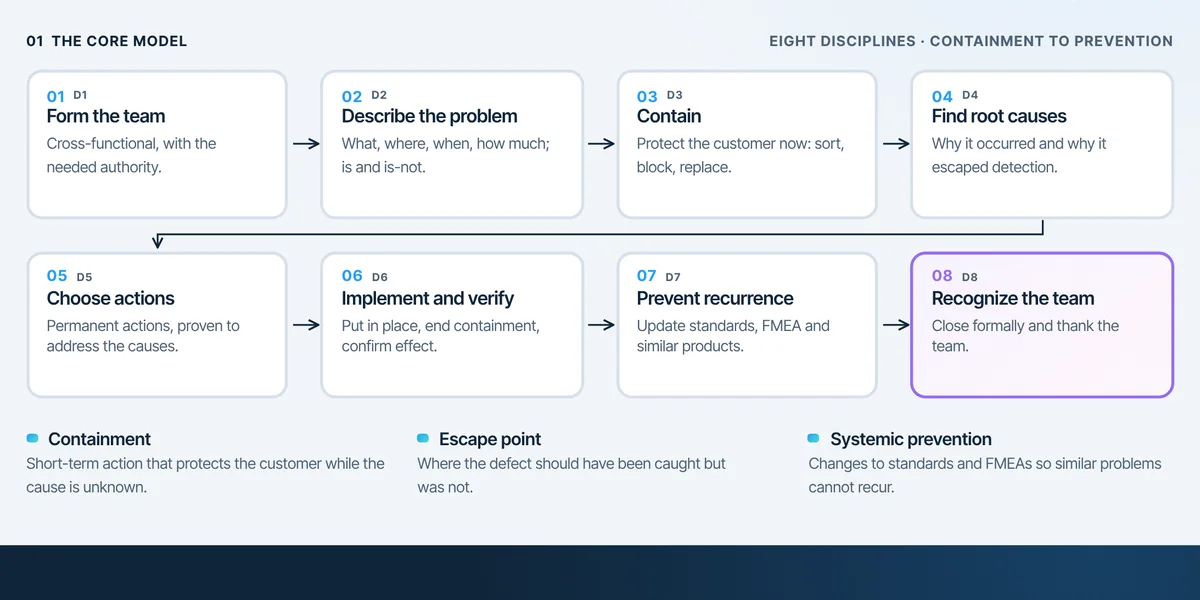
8D Problem Solving
8D is a disciplined team method for serious or recurring problems: eight steps take the team from immediate containment through root cause to permanent prevention.
 Quality Management
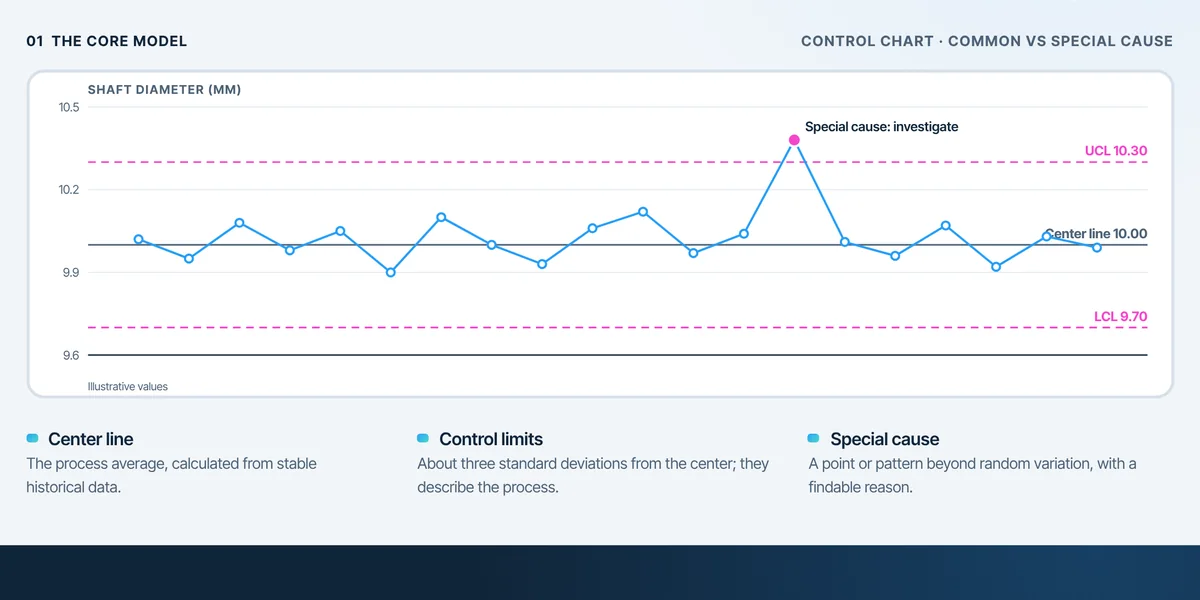
SPC and Control Charts
Statistical process control (SPC) uses control charts to separate the normal, common-cause variation of a stable process from special causes that signal something has changed.
 Quality Management
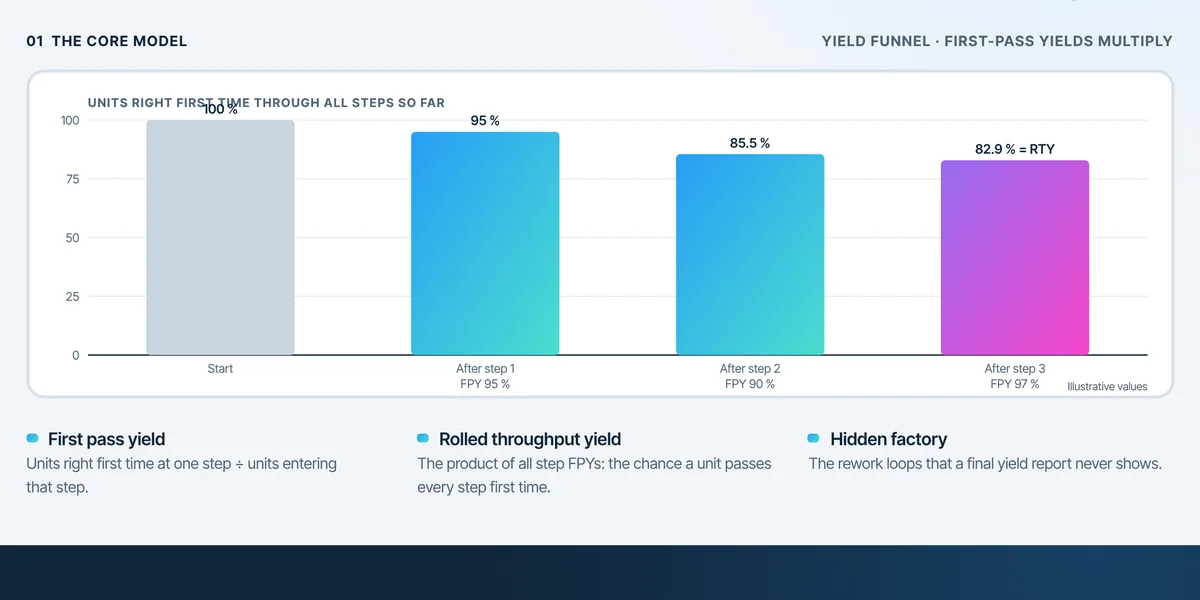
First Pass Yield vs Rolled Throughput Yield
First pass yield measures right-first-time at one step, while rolled throughput yield multiplies all steps to show the true first-time rate.
 Quality Management
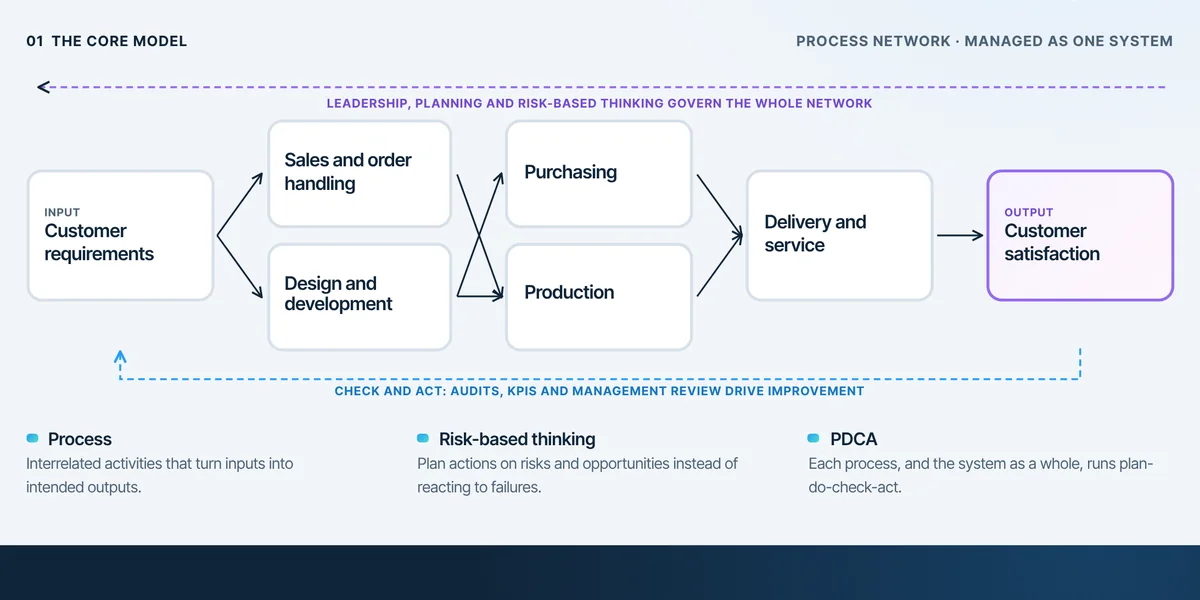
ISO 9001 Process Approach
The ISO 9001 process approach manages an organization as a network of interacting processes, each with an owner and measures, steered by risk-based thinking and the PDCA cycle.
 Quality Management
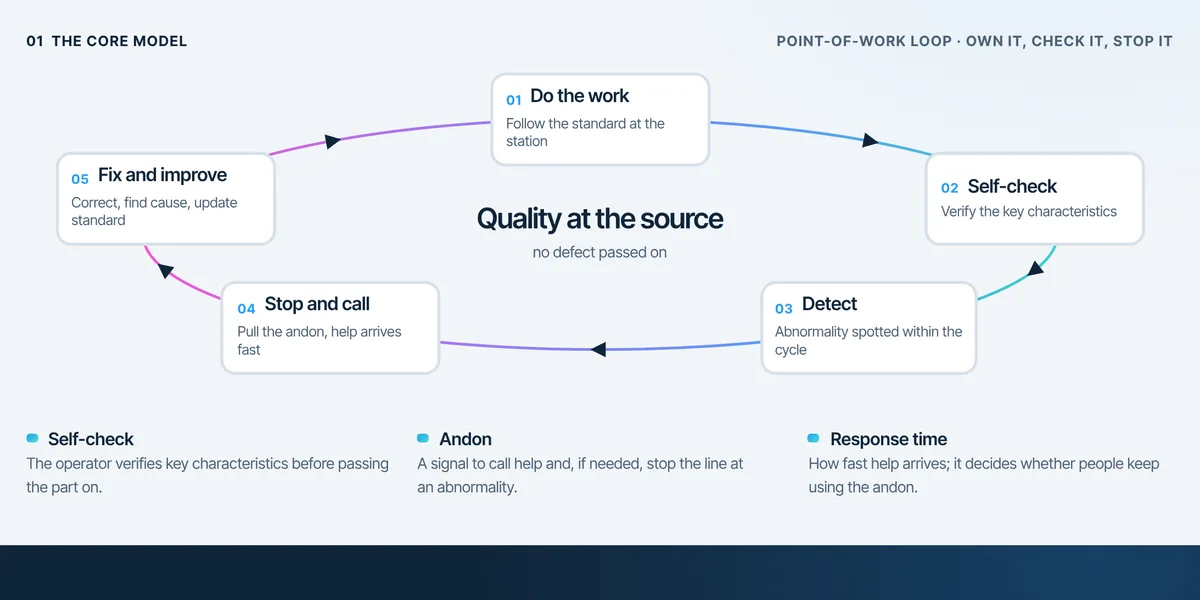
Quality at the Source
Quality at the source means each person checks their own work and stops to fix any abnormality before passing it on, so defects are never sent downstream.
 Quality Management
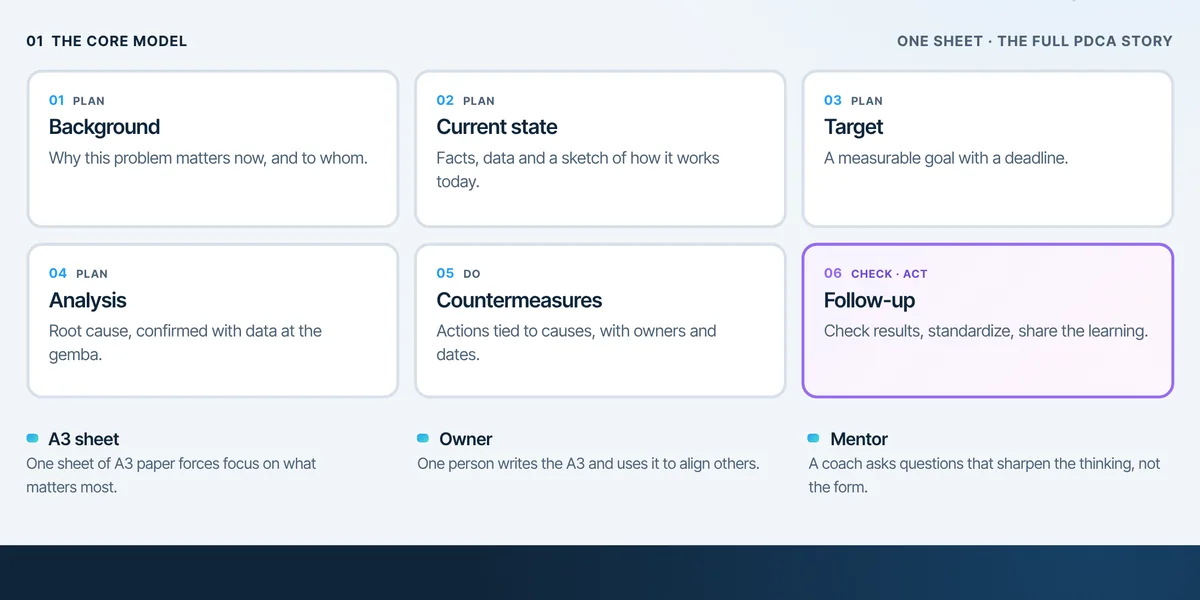
A3 Problem Solving
A3 problem solving tells the full story of one problem on a single A3 sheet, from background and current state to root cause, countermeasures and follow-up.
 Leadership & People
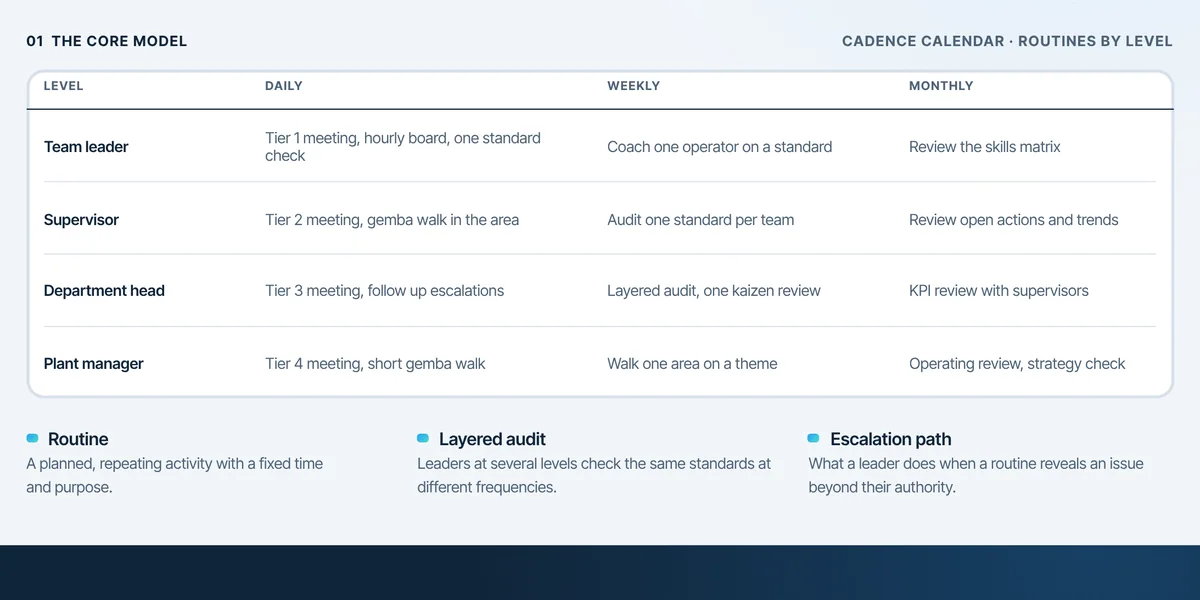
Leader Standard Work
Leader standard work defines the daily, weekly and monthly routines each leadership level performs to sustain standards, coach people and escalate problems.
 Leadership & People
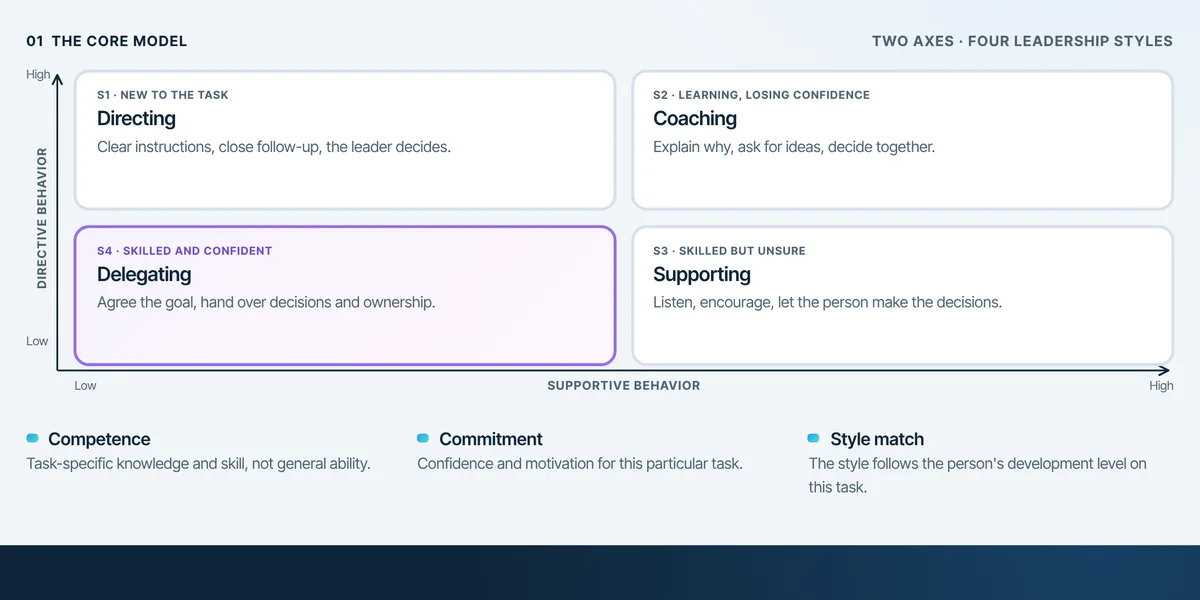
Situational Leadership
Situational leadership matches the amount of direction and support a leader gives to the competence and commitment a person shows for a specific task.
 Leadership & People
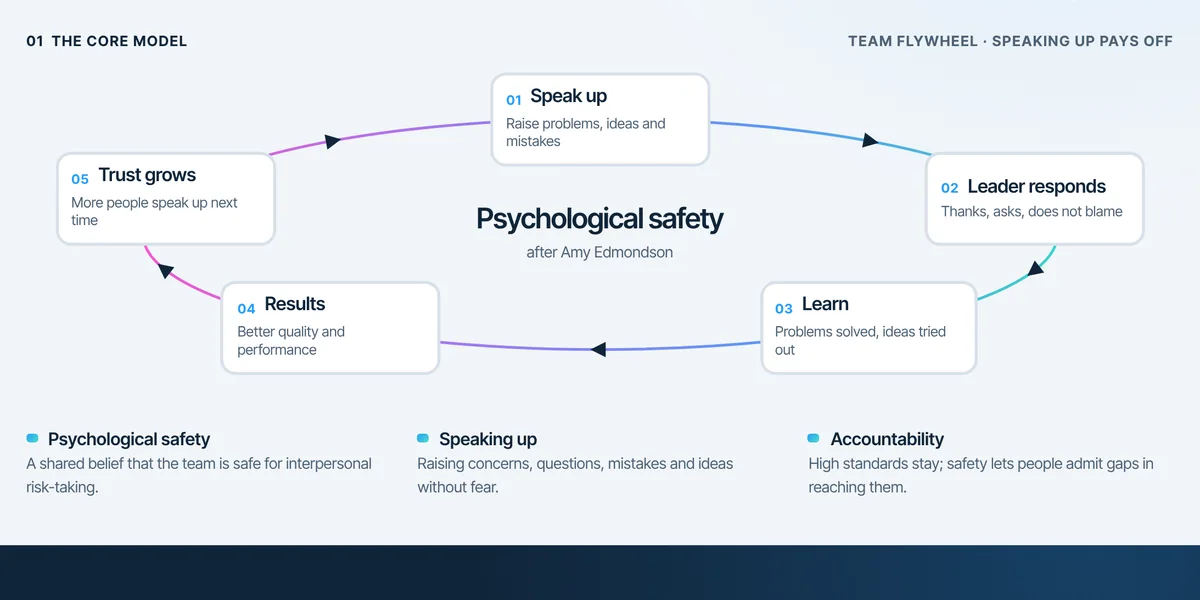
Psychological Safety at Work
Psychological safety is a shared belief that the team is safe for interpersonal risk: people can raise problems, admit mistakes and offer ideas without fear of blame.
 Leadership & People
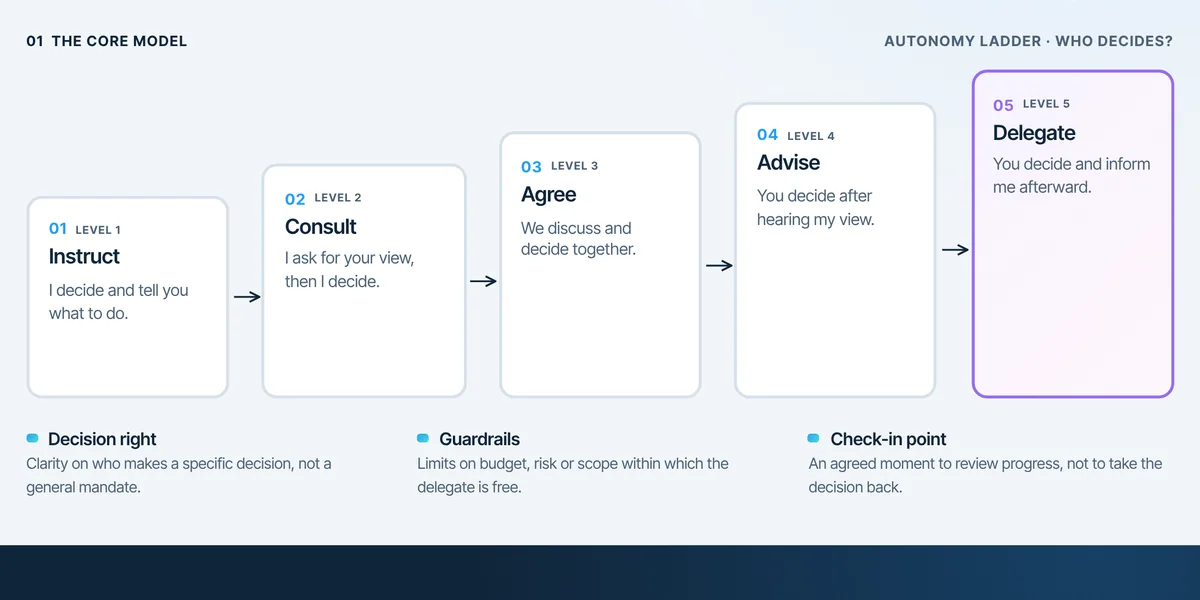
Delegation Levels
Delegation levels make decision rights explicit: for each decision, leader and team agree how much autonomy the team has, from following instructions to full ownership.
 Leadership & People
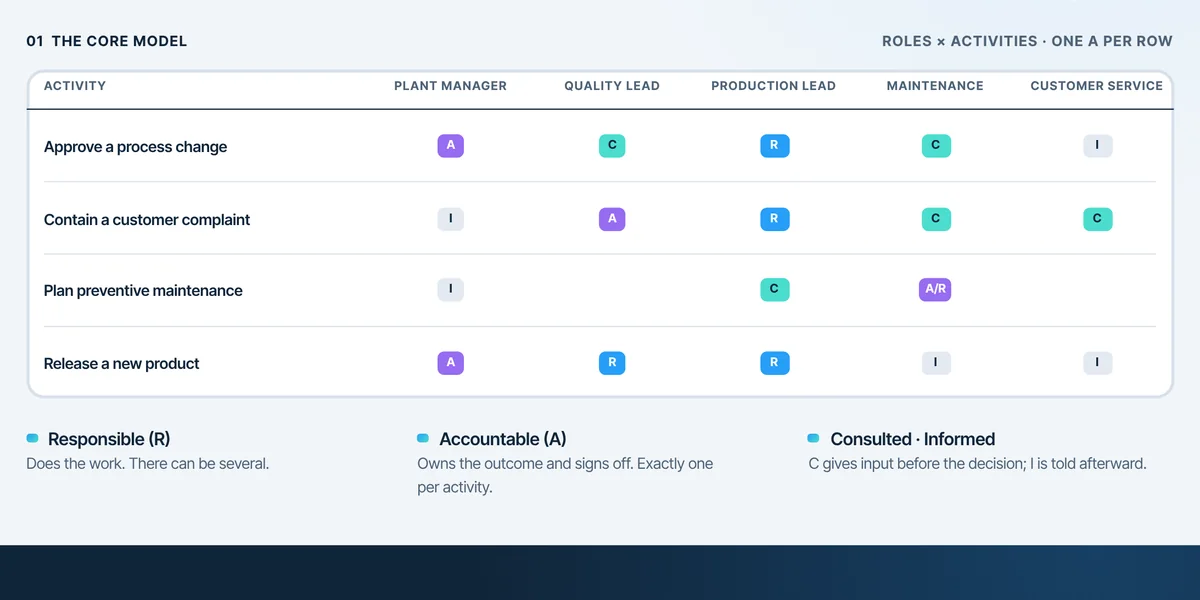
RACI Responsibility Matrix
A RACI matrix maps activities against roles and marks who is Responsible, Accountable, Consulted and Informed, so every task has clear ownership.
 Leadership & People
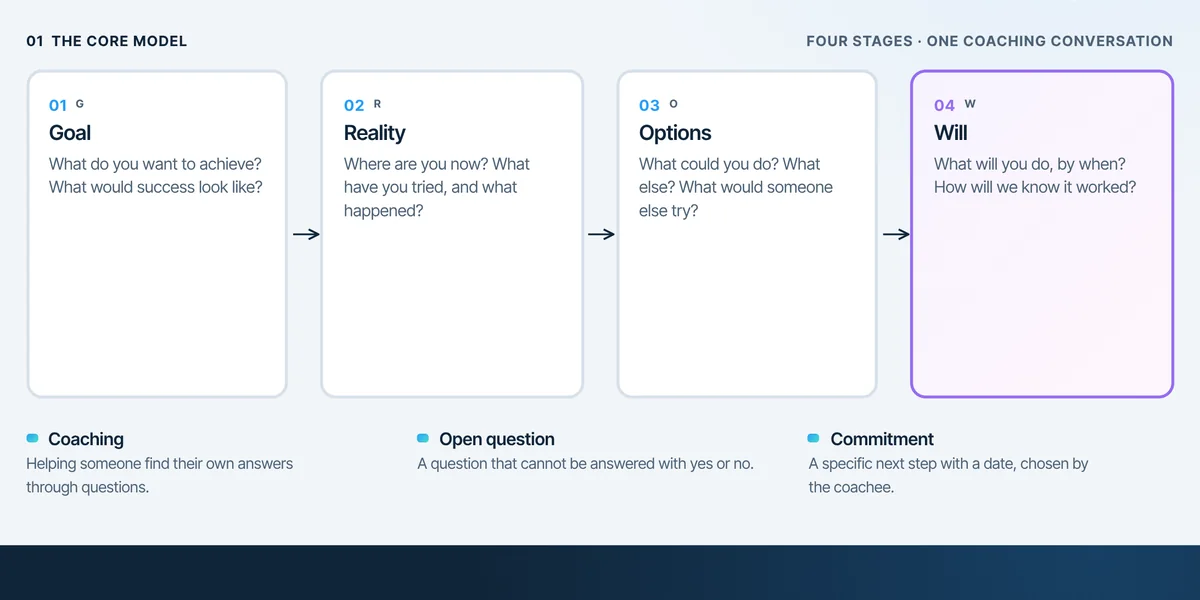
Coaching with GROW
GROW is a simple structure for coaching conversations: clarify the Goal, explore the current Reality, generate Options and agree the Will to act.
 Leadership & People
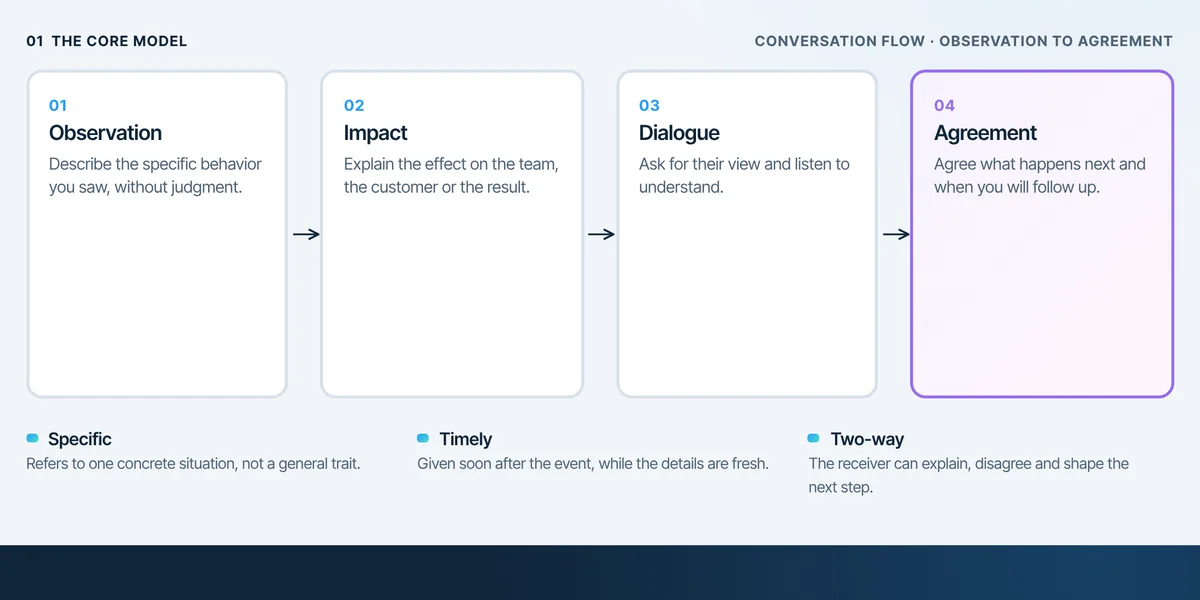
Feedback That Drives Improvement
Effective feedback describes a specific observed behavior and its impact, invites the other person's view and ends with an agreed next step.
 Leadership & People
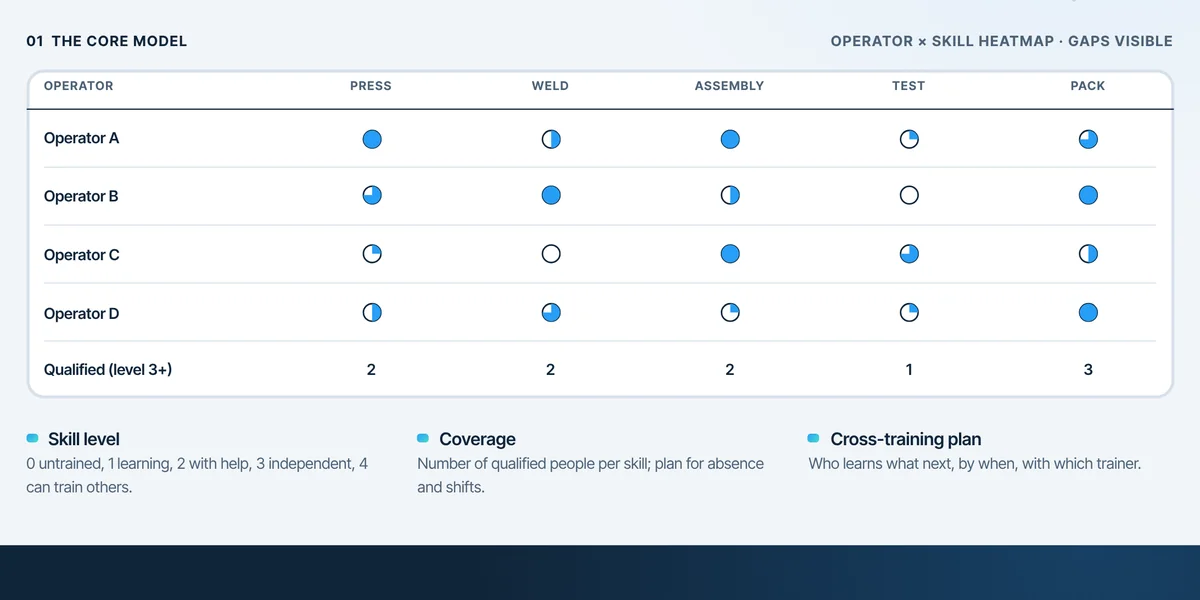
The Skill Matrix
A skill matrix shows, for every person and every task, the current level of qualification, so coverage gaps and cross-training needs become visible at a glance.
 Leadership & People
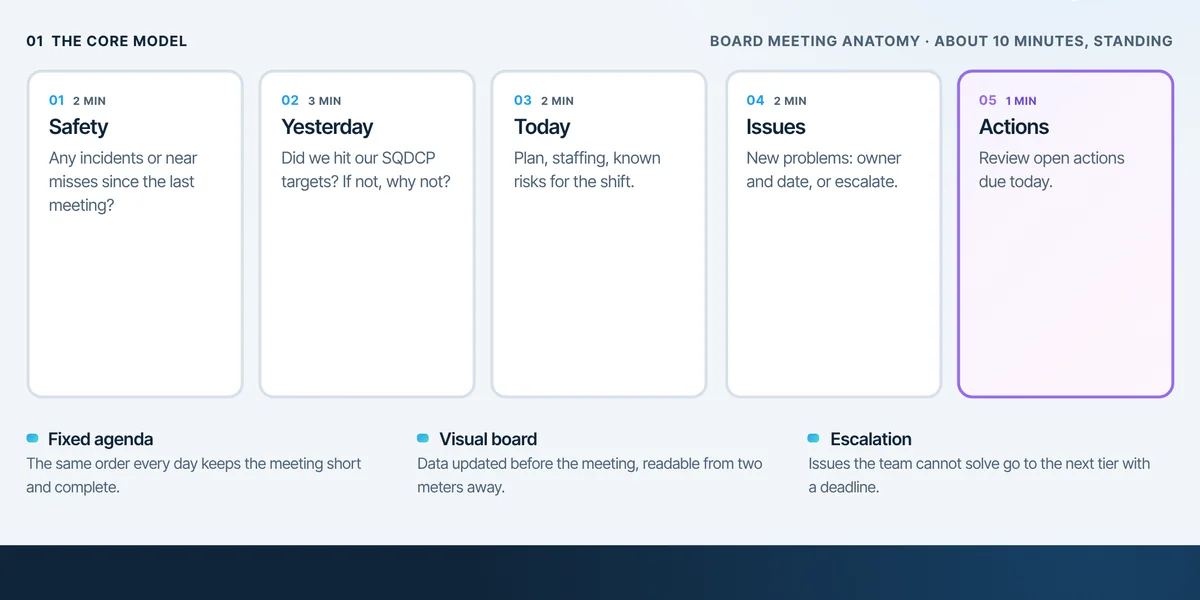
Effective Tier Meetings
A tier meeting is a short, standing meeting at a visual board where a team reviews performance, raises abnormalities, assigns actions and escalates what it cannot solve.
 Leadership & People
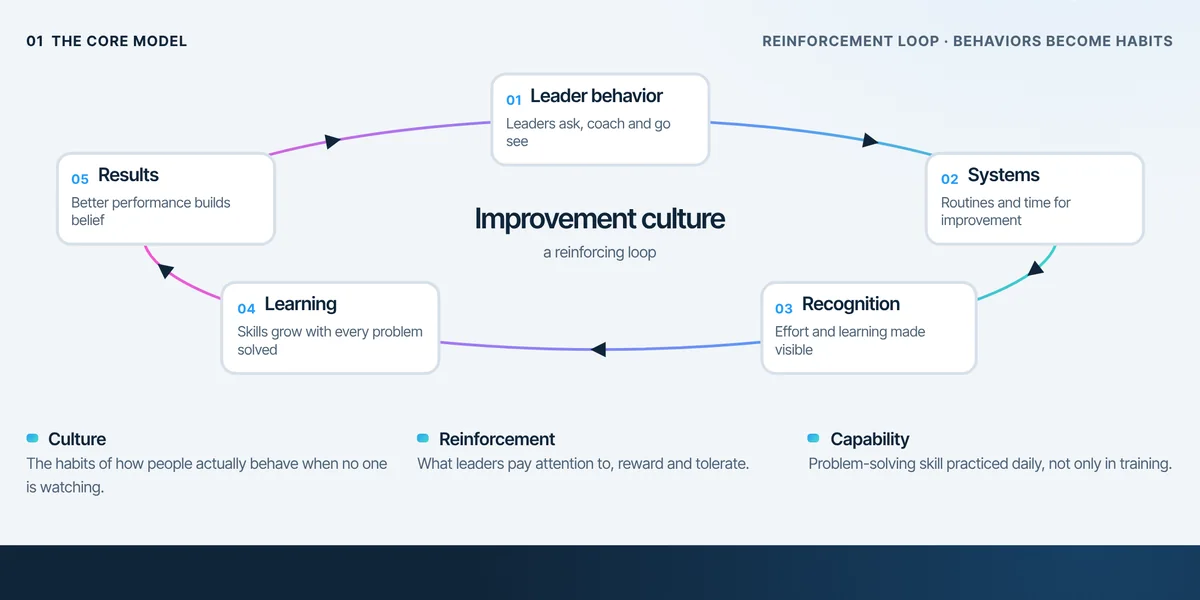
Building a Continuous Improvement Culture
A continuous improvement culture is one where improving the work is part of everyone's daily job, reinforced by leader behavior, routines, recognition and learning.
 Process Improvement
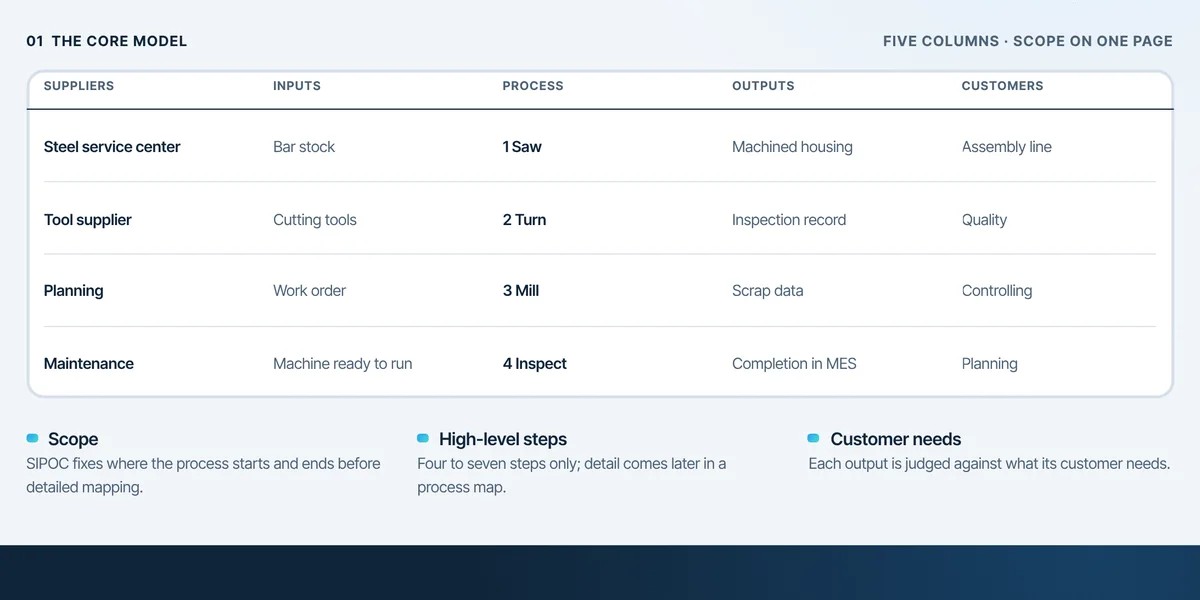
SIPOC Process Mapping
SIPOC is a one-page, high-level map of a process that names its Suppliers, Inputs, main Process steps, Outputs and Customers, so a team agrees on scope before going into detail.
 Process Improvement
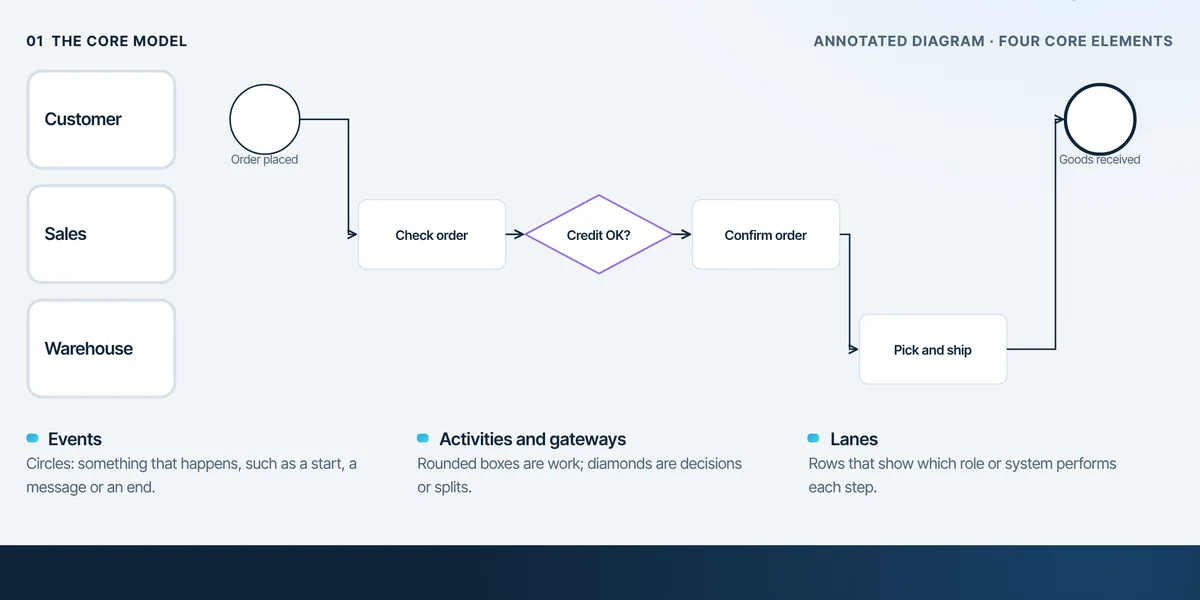
BPMN Process Mapping Essentials
BPMN (Business Process Model and Notation) is a standard visual language for process diagrams.
 Process Improvement
DMAIC Explained
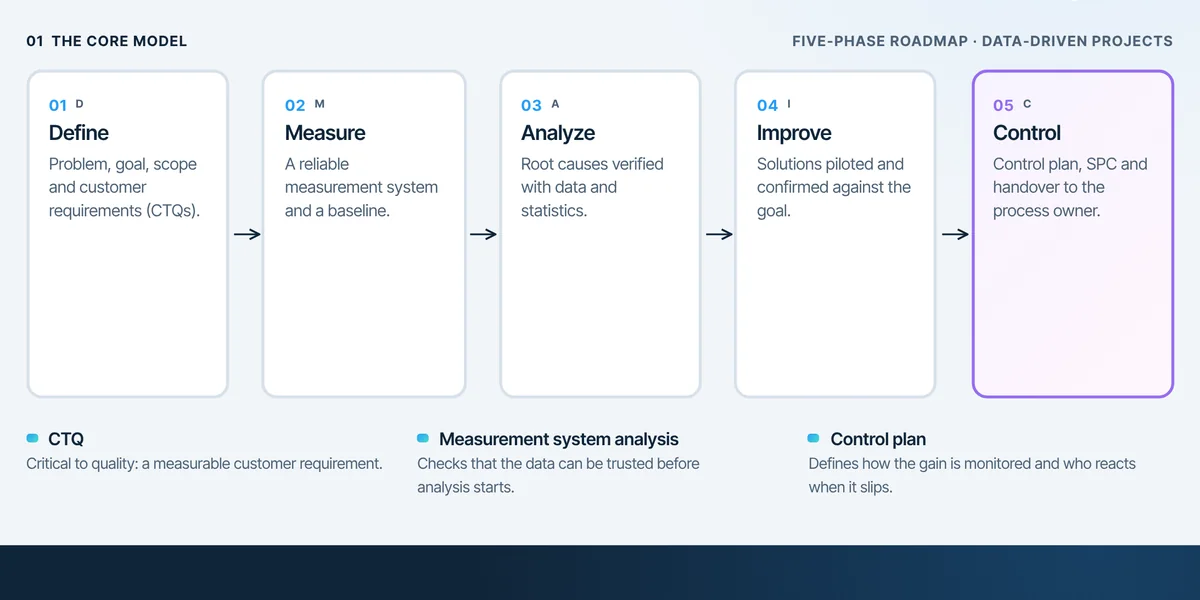
DMAIC is the five-phase Six Sigma roadmap for improving an existing process with data: Define, Measure, Analyze, Improve and Control.
 Process Improvement
Pareto Analysis: The Vital Few
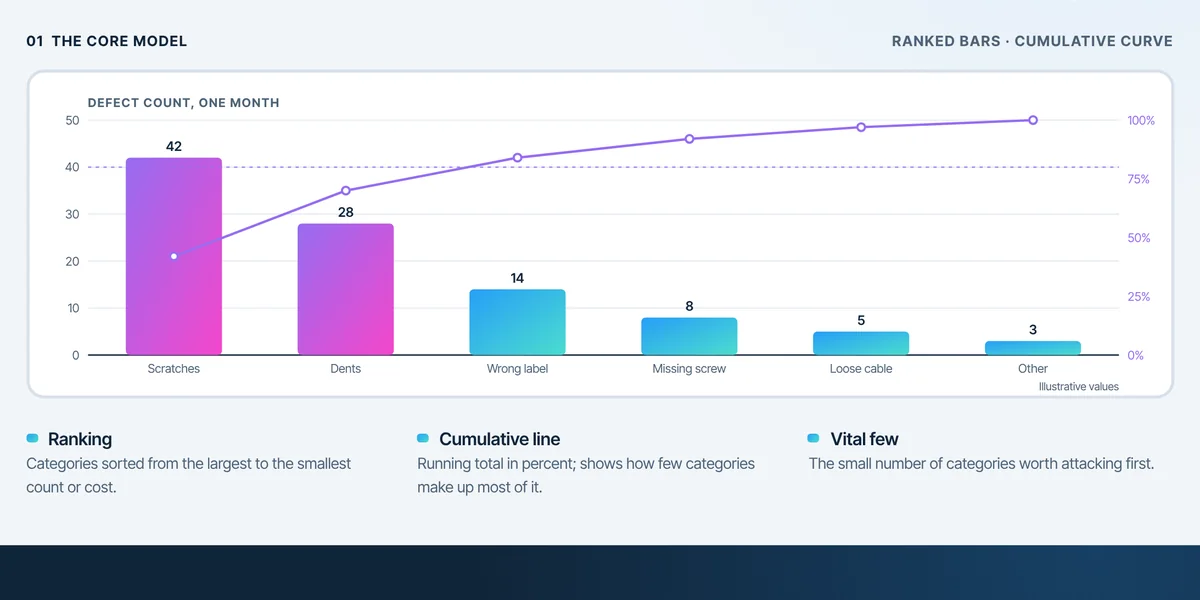
Pareto analysis ranks problem categories by frequency or impact, showing that a few categories usually account for most of the total, so effort goes where it counts.
 Process Improvement
Process Cycle Efficiency
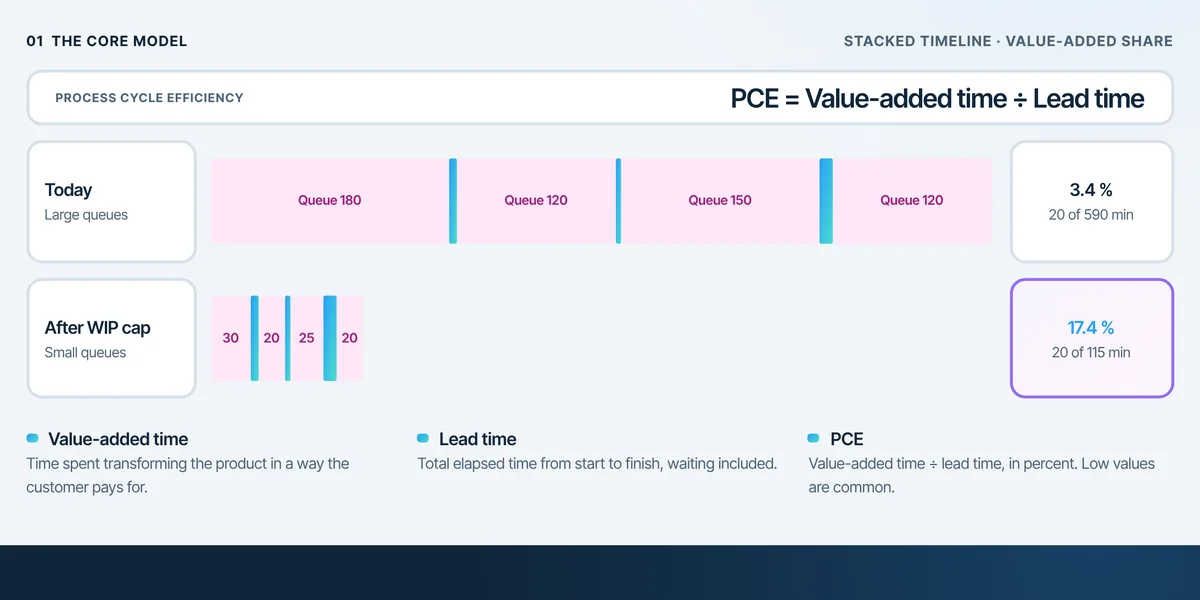
Process cycle efficiency (PCE) is the share of total lead time spent on value-added work.
 Process Improvement
Process Mining vs Process Mapping
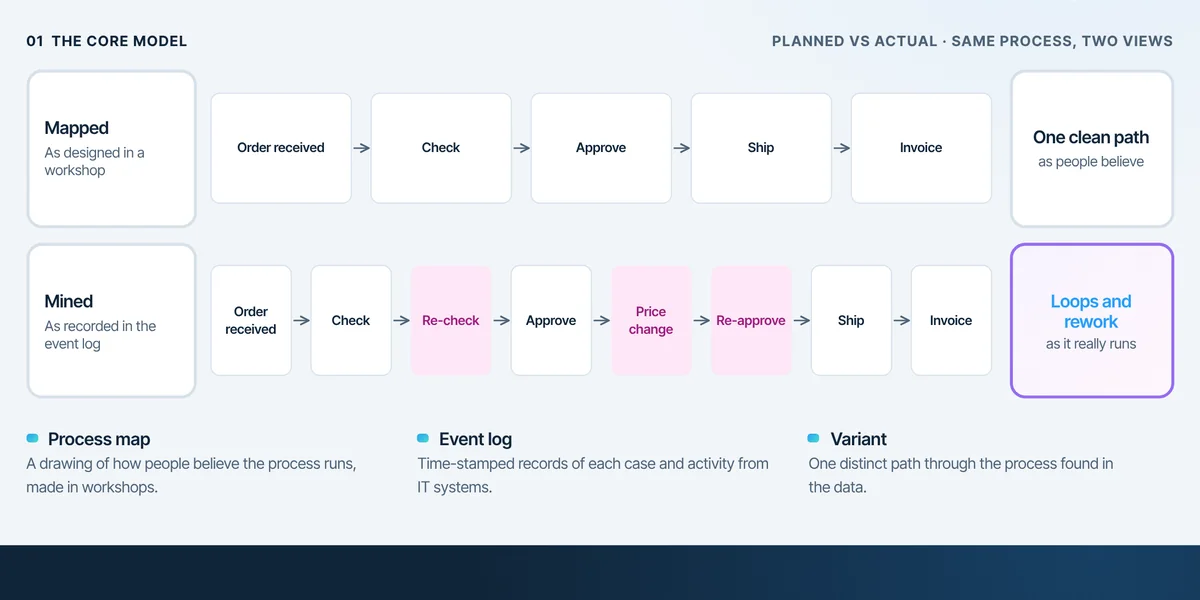
Process mapping shows a process as people describe it, while process mining rebuilds it from event logs as it actually runs.
 Process Improvement
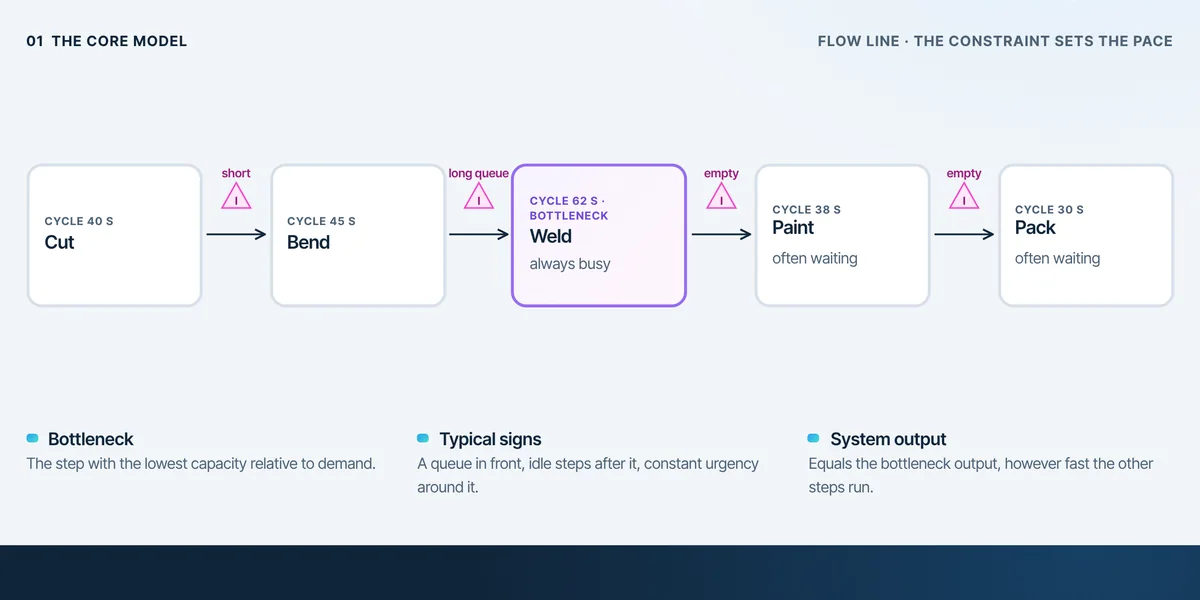
Bottleneck Analysis
Bottleneck analysis finds the one step in a flow whose capacity limits the output of the whole system, so improvement effort goes where it raises throughput.
 Process Improvement
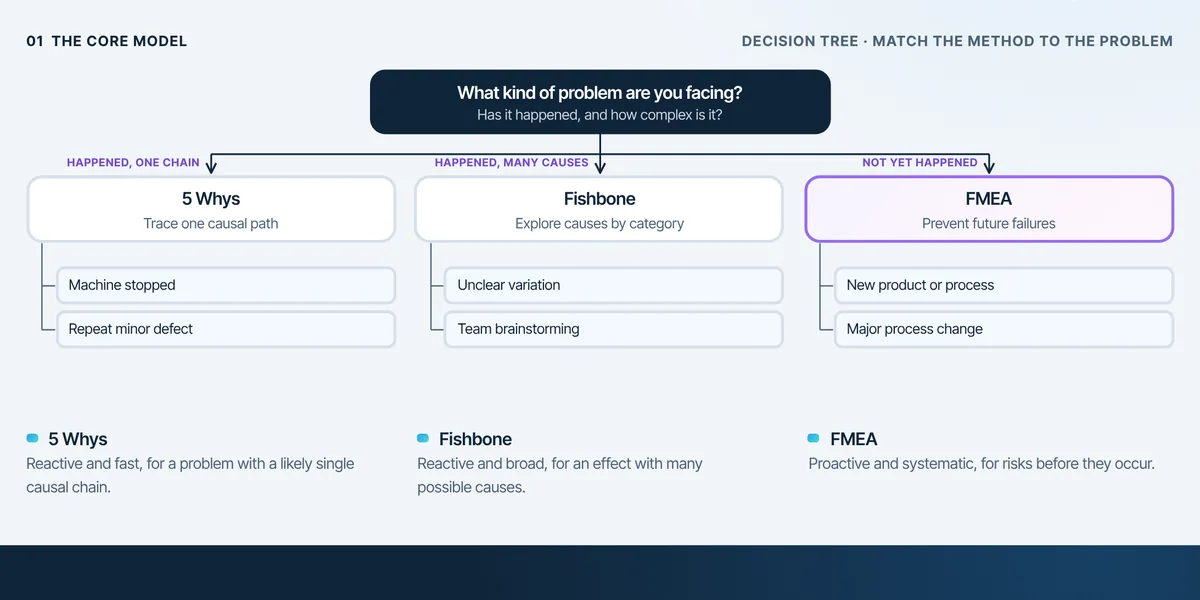
The 5 Whys vs Fishbone vs FMEA
How to choose between 5 Whys, fishbone and FMEA, depending on whether the problem has happened and how complex it is.
 Process Improvement
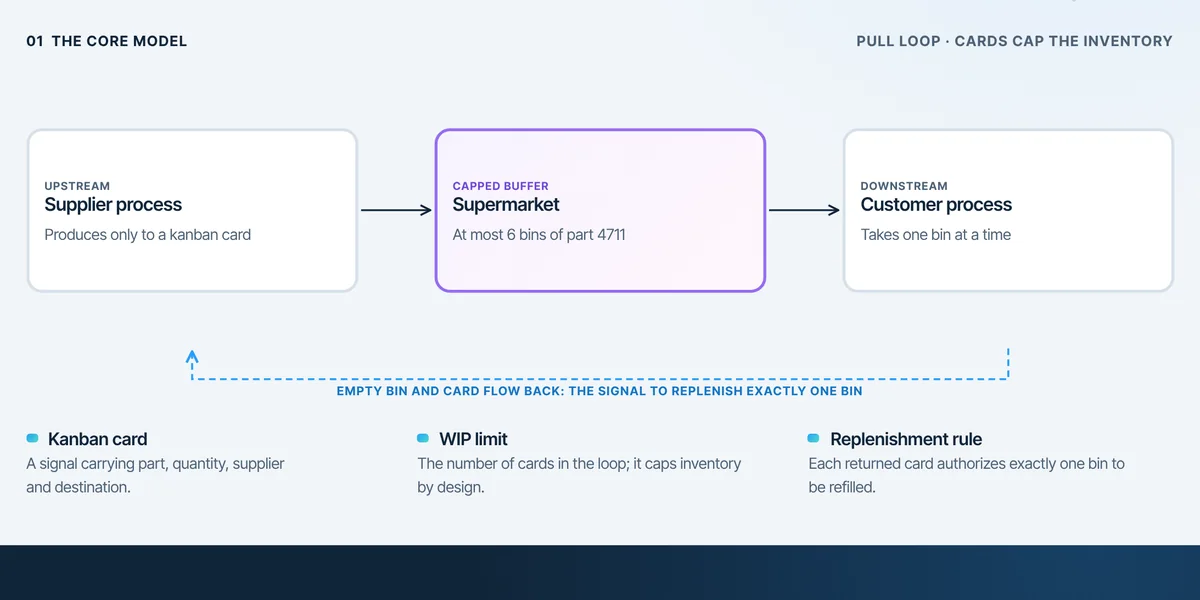
Kanban System Design
A kanban system controls production and material flow with signals: a downstream process consumes, the empty bin or card travels back and authorizes exactly one replenishment.
 Process Improvement
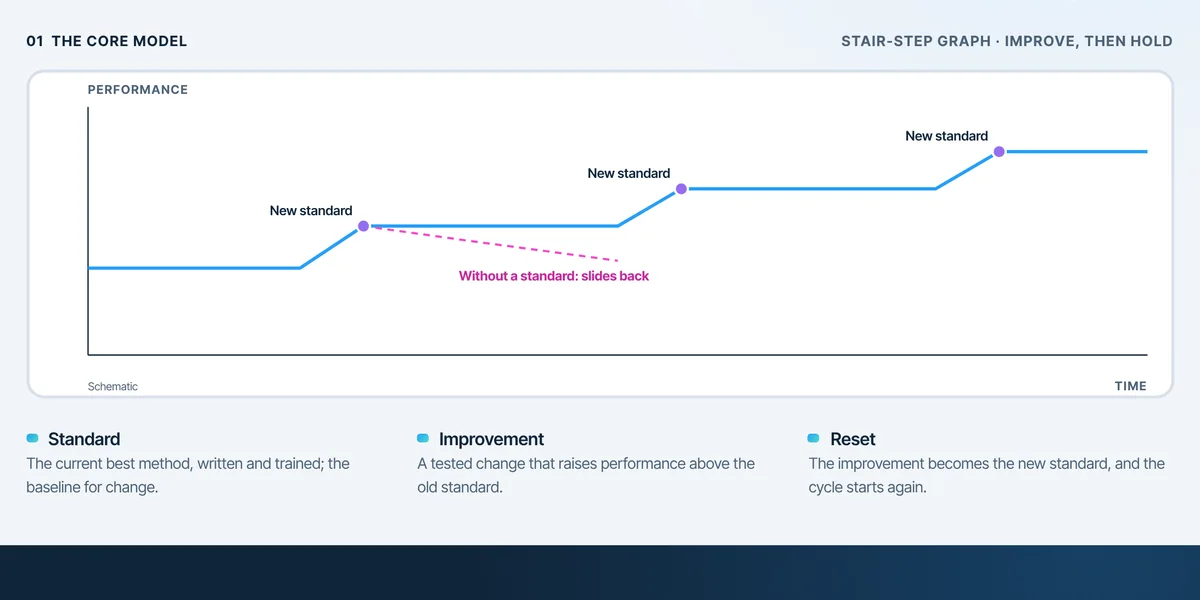
Standardization vs Continuous Improvement
Standardization and continuous improvement work as a pair: a standard holds the current best method, improvement raises it, and the new level becomes the next standard.
 Supply Chain & Logistics
End-to-End Supply Chain Map
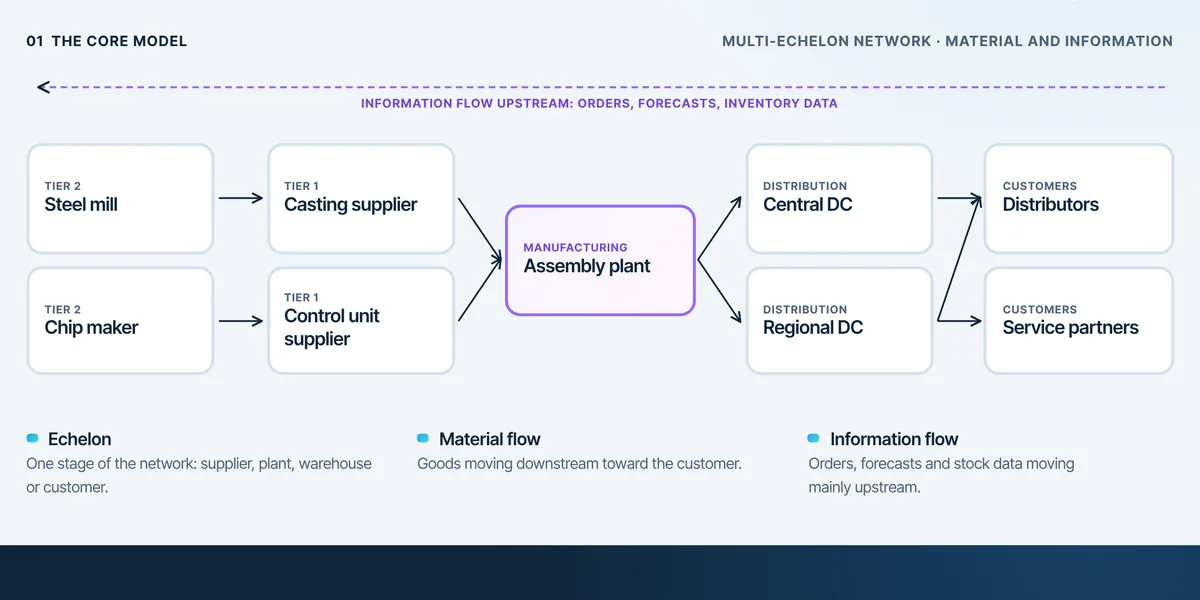
An end-to-end supply chain map shows every stage from raw material suppliers to end customers, with the material flowing downstream and the information flowing back.
 Supply Chain & Logistics
Inventory ABC Analysis
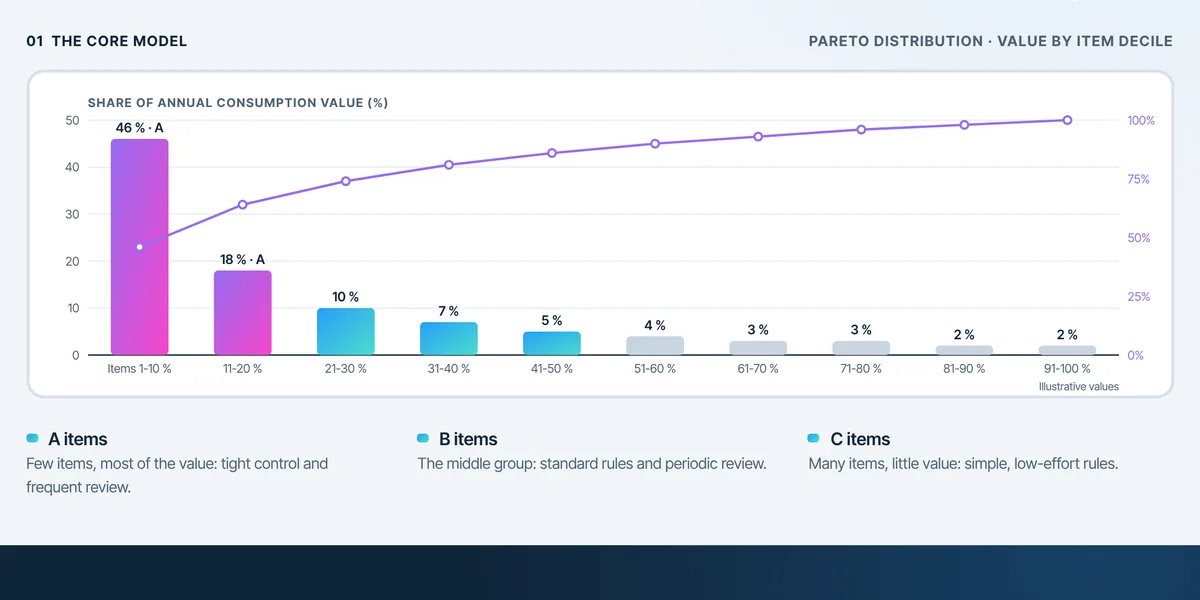
ABC analysis ranks inventory items by annual consumption value and splits them into classes, so that control effort matches the value at stake.
 Supply Chain & Logistics
Safety Stock Explained
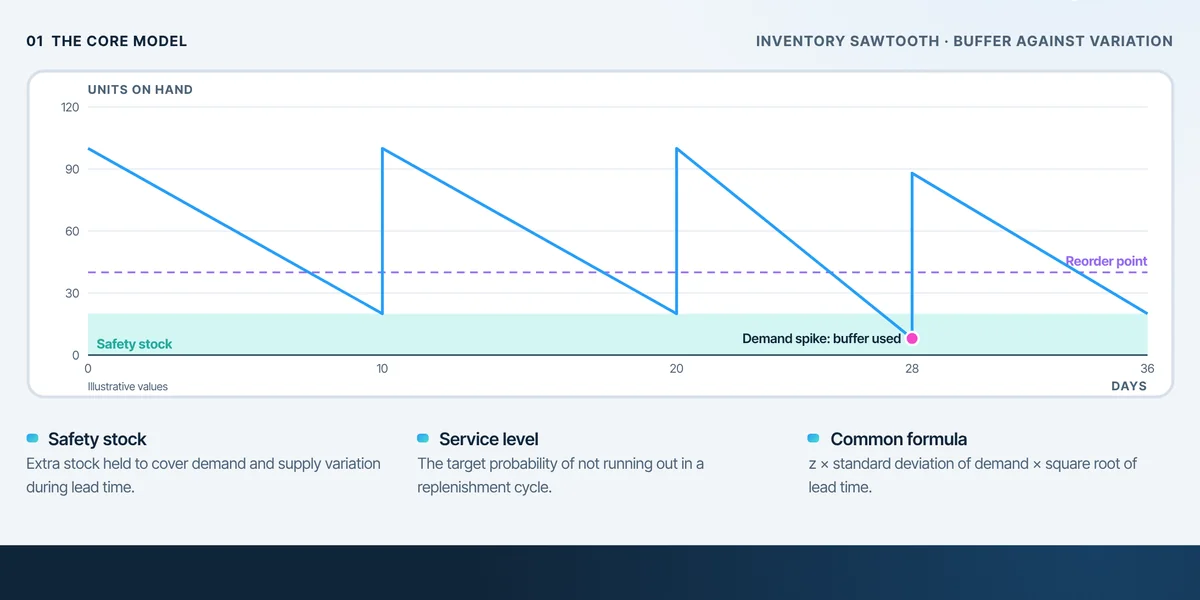
Safety stock is extra inventory held to protect against variation in demand and supply lead time, so a target service level can be met.
 Supply Chain & Logistics
Bullwhip Effect
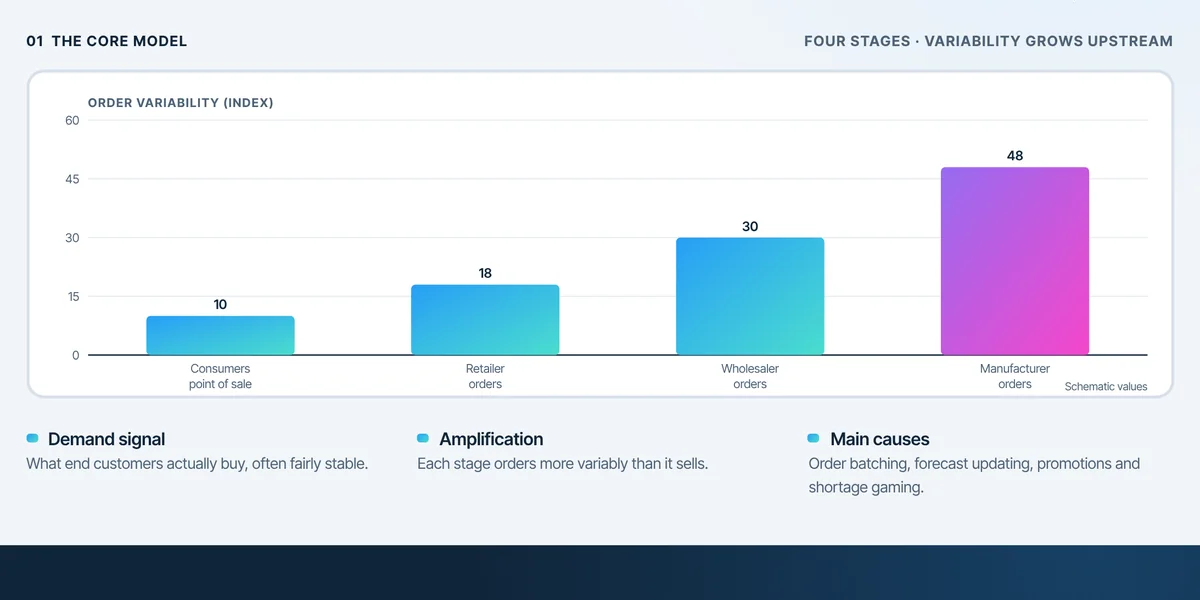
The bullwhip effect is the amplification of demand variability as orders move upstream: small changes in consumer demand become large swings for suppliers.
 Supply Chain & Logistics
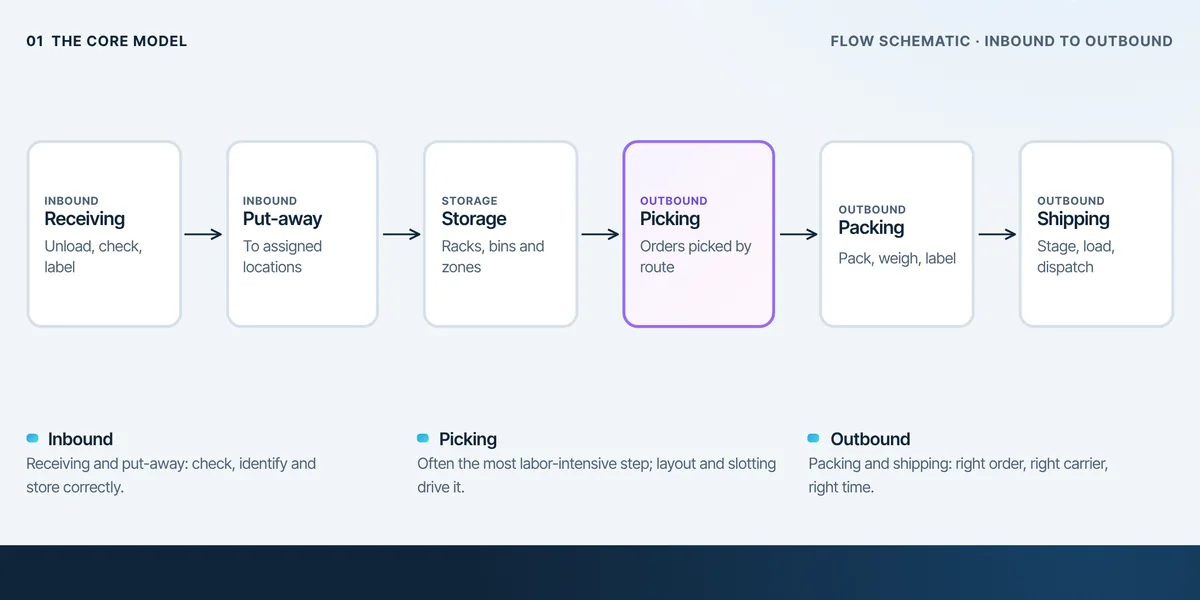
Warehouse Material Flow
Warehouse material flow is the path goods take from the receiving dock through storage and picking to the shipping dock.
 Supply Chain & Logistics
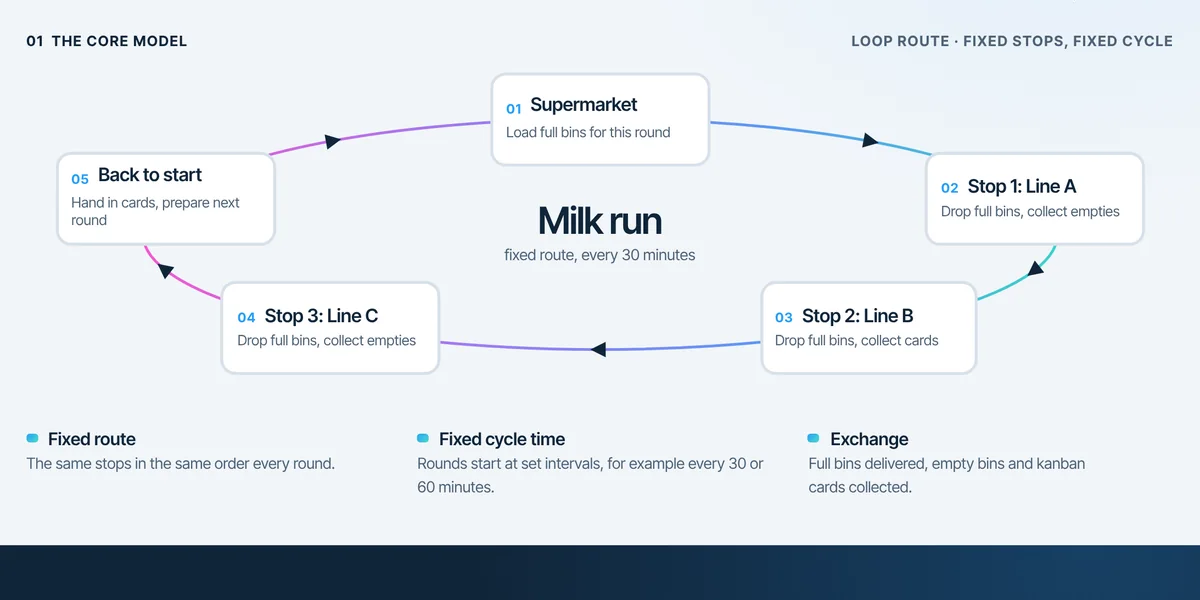
Milk Run Logistics
A milk run is a scheduled delivery loop that serves several stops on a fixed route and timetable, delivering full bins and collecting empties and kanban signals.
 Supply Chain & Logistics
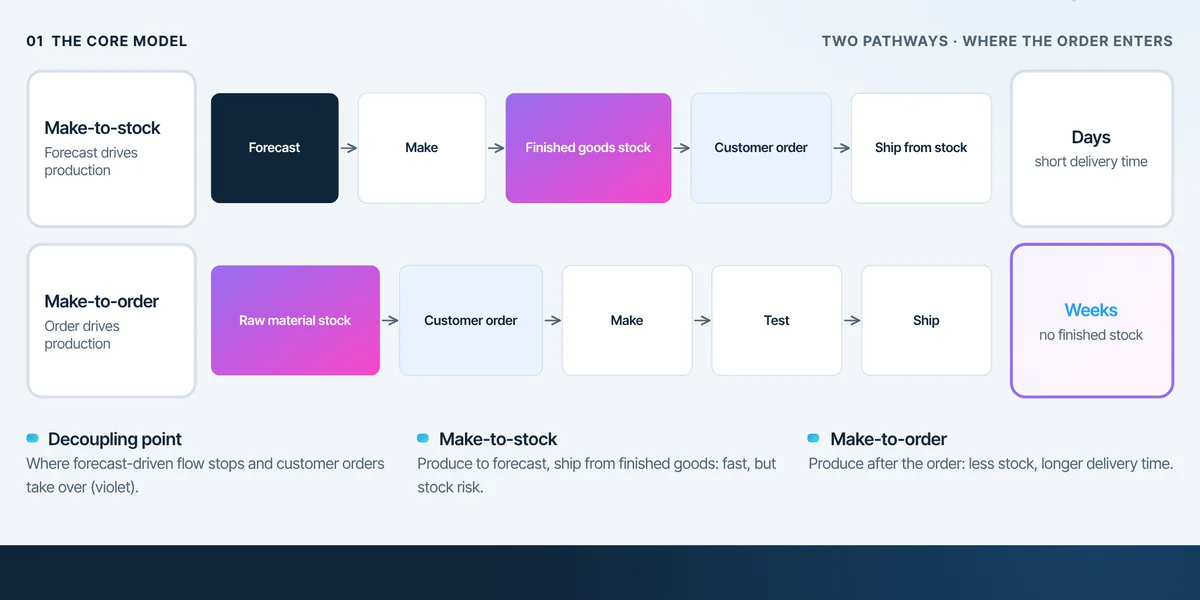
Make-to-Stock vs Make-to-Order
Make-to-stock ships from finished goods built to forecast, while make-to-order starts production only after the customer order.
 Supply Chain & Logistics
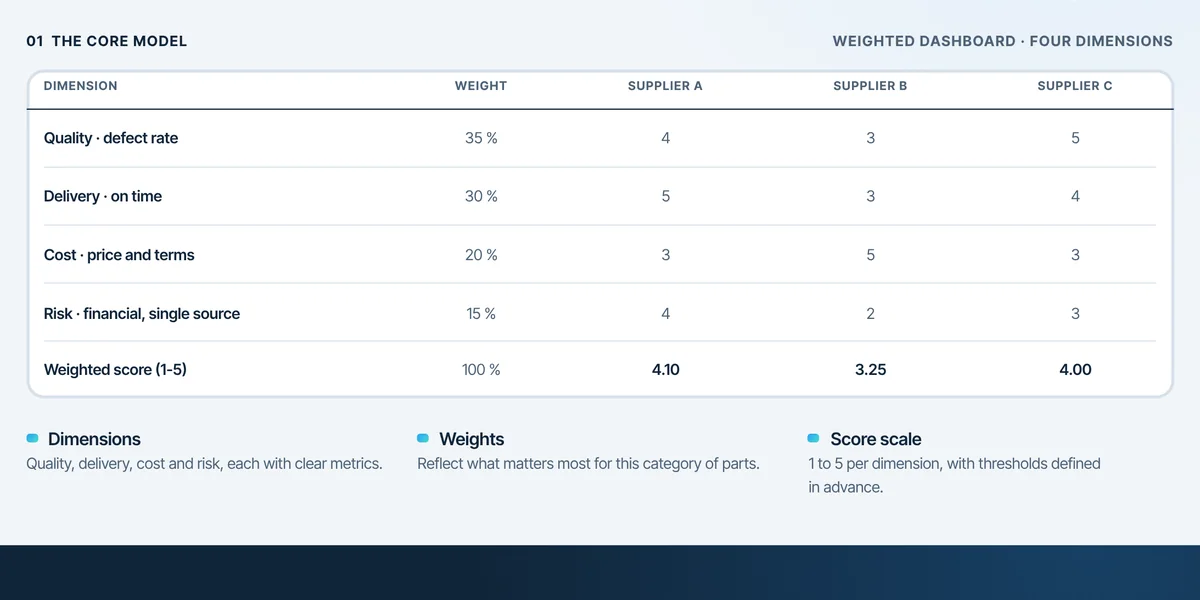
Supplier Performance Scorecard
A supplier performance scorecard rates suppliers on a few weighted dimensions, typically quality, delivery, cost and risk, to steer reviews, development and sourcing decisions.
 Supply Chain & Logistics
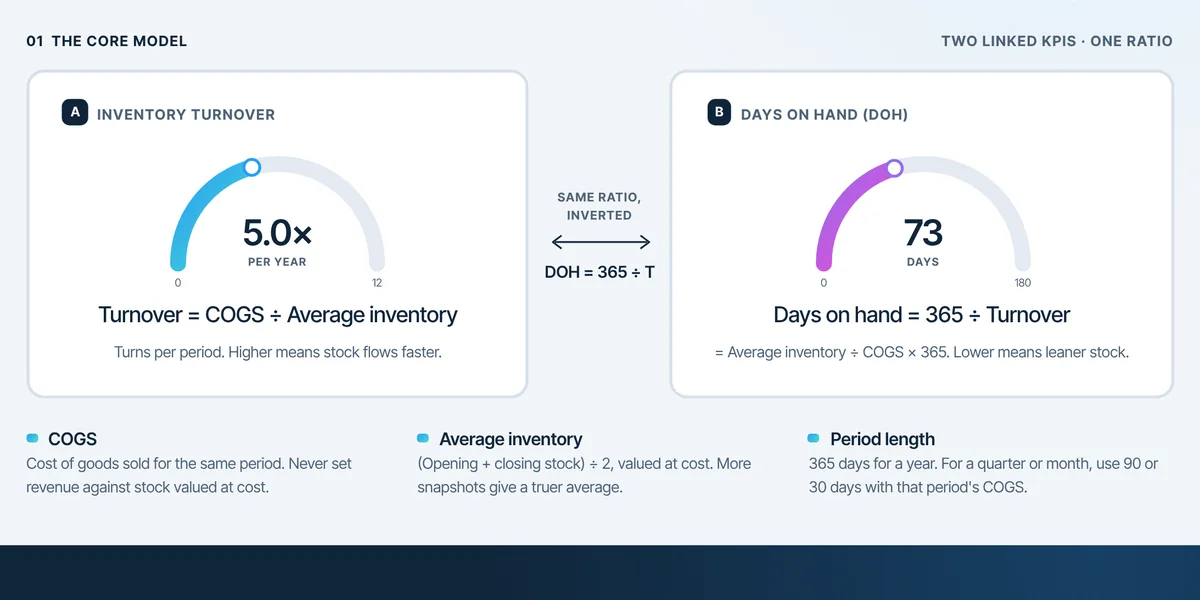
Inventory Turnover and Days on Hand
Inventory turnover and days on hand express one ratio two ways: how often stock turns, and how many days it lasts.
 Supply Chain & Logistics
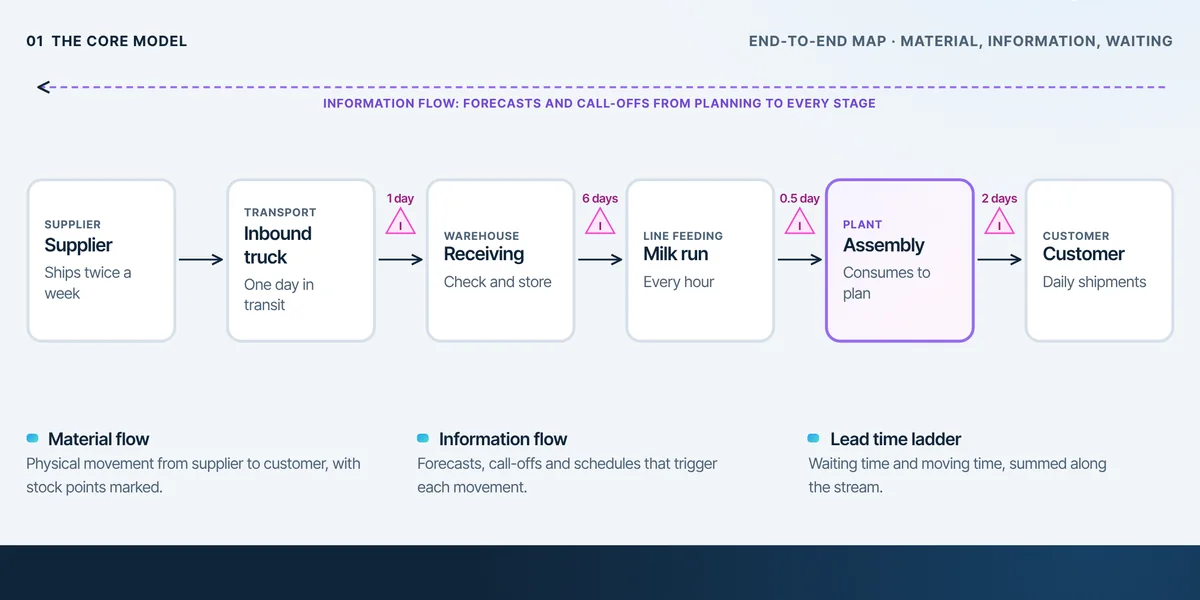
Logistics Value Stream Mapping
A logistics value stream map follows material and information from supplier to customer and shows where goods move, where they wait and what triggers each movement.
 Strategy & Performance
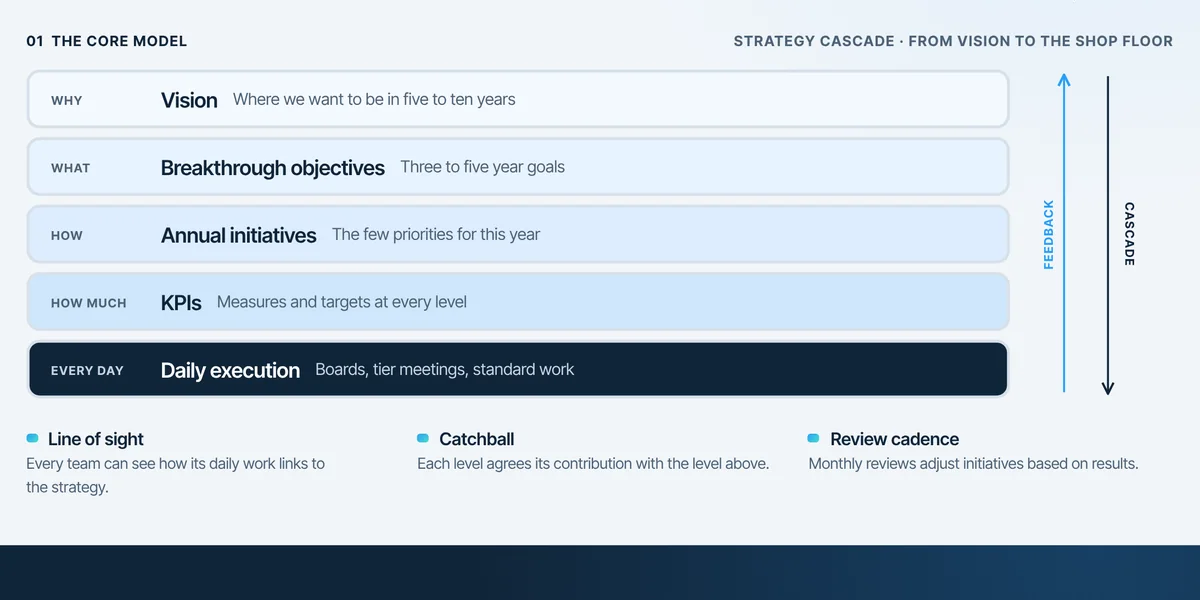
Strategy Deployment from Vision to Action
Strategy deployment translates a long-term vision into a few objectives, annual initiatives, measures and daily routines, so every level knows how its work contributes.
 Strategy & Performance
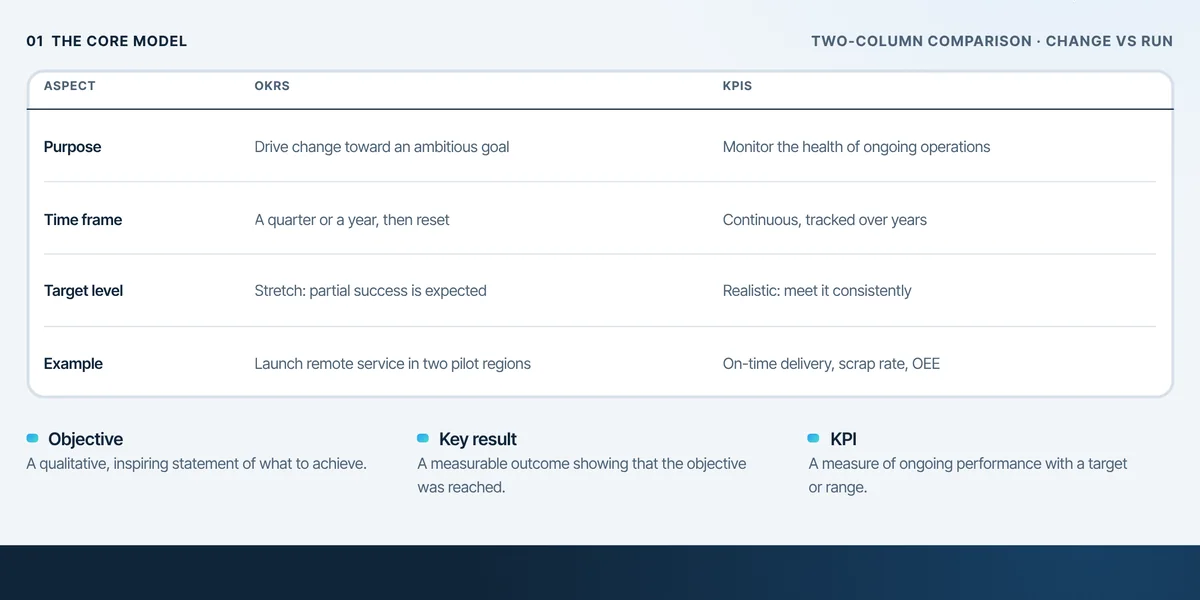
OKRs vs KPIs
OKRs set ambitious goals for change in a fixed period, while KPIs track the ongoing health of operations.
 Strategy & Performance
Balanced Scorecard
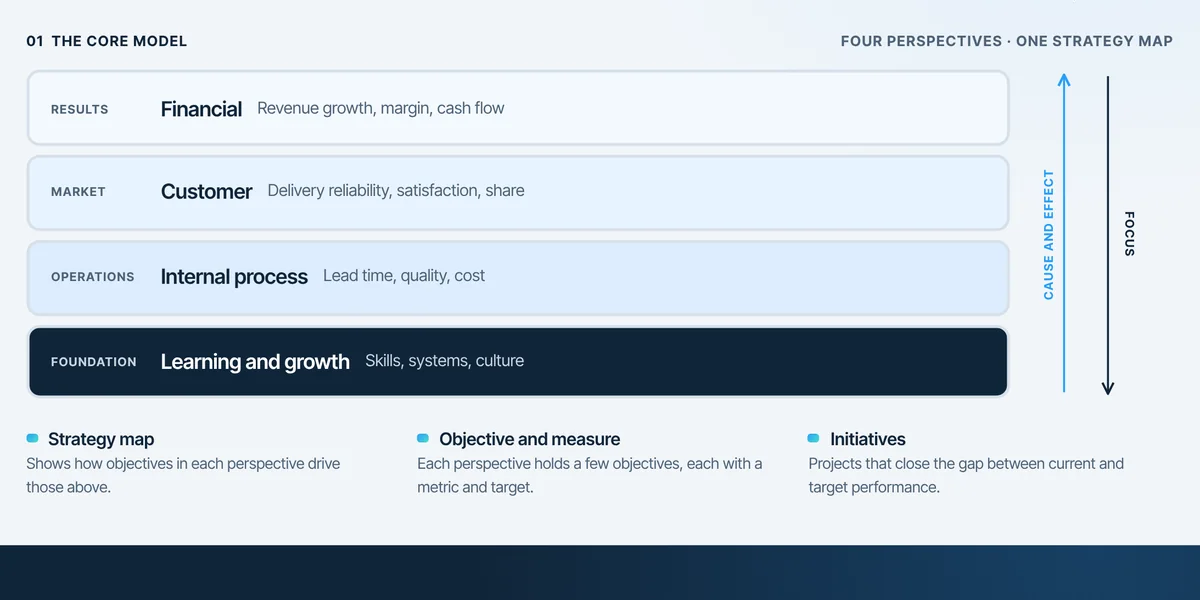
The balanced scorecard translates strategy into objectives and measures across four linked perspectives: financial, customer, internal process, and learning and growth.
 Strategy & Performance
KPI Tree for Manufacturing
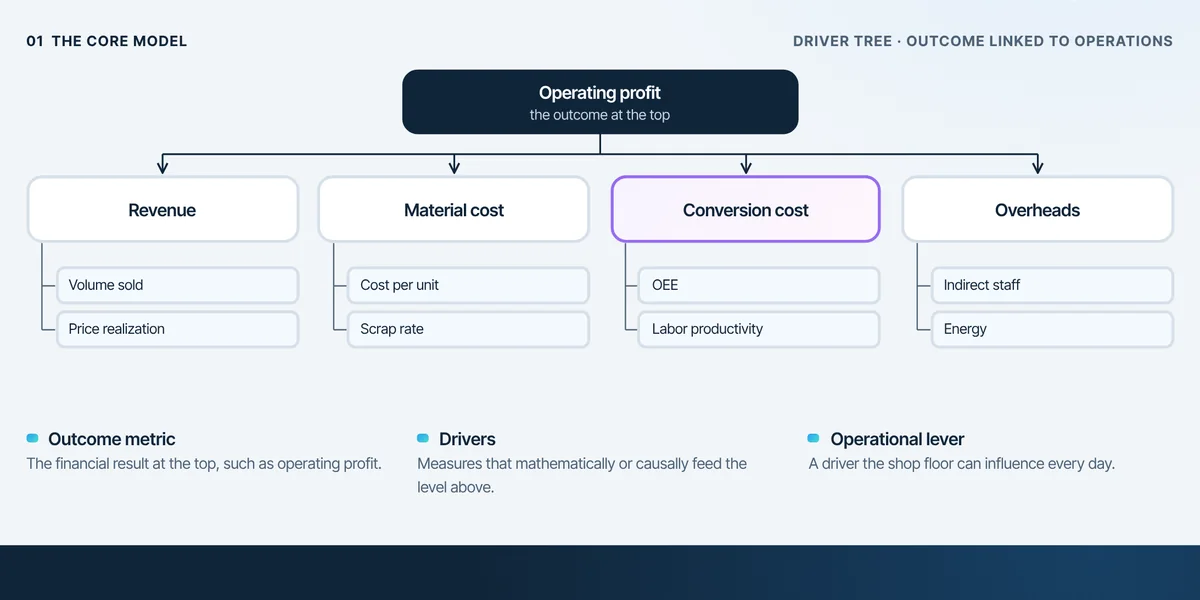
A KPI tree breaks a financial outcome down into the operational drivers behind it, so every team can see how its metrics move the result.
 Strategy & Performance
Leading vs Lagging Indicators
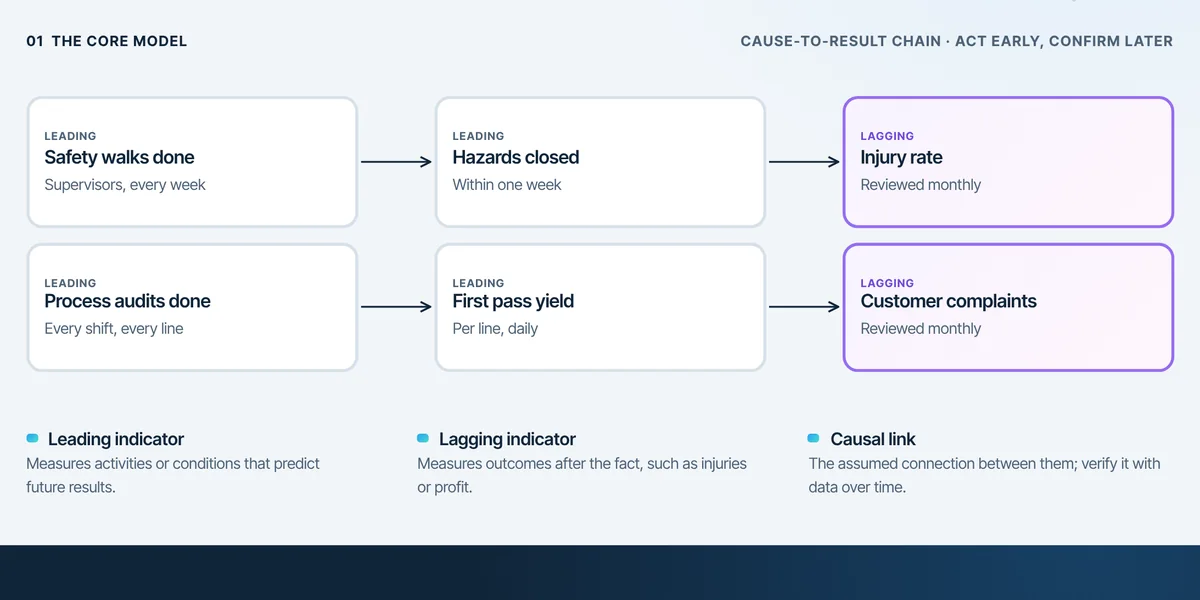
Leading indicators predict future results, lagging indicators confirm them after the fact.
 Strategy & Performance
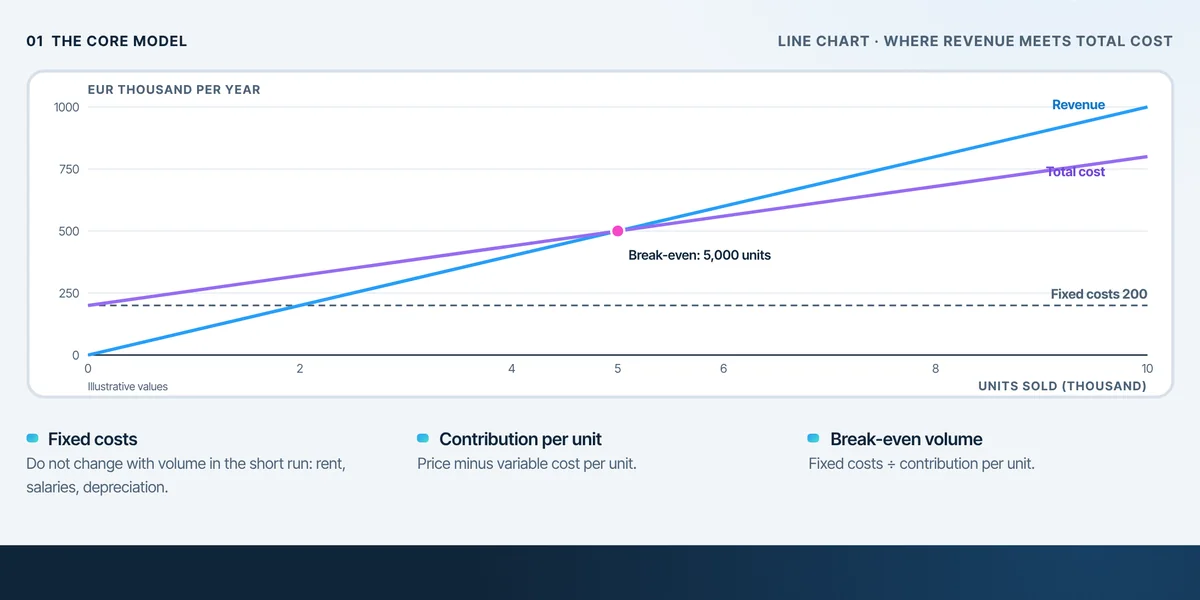
Contribution Margin Explained
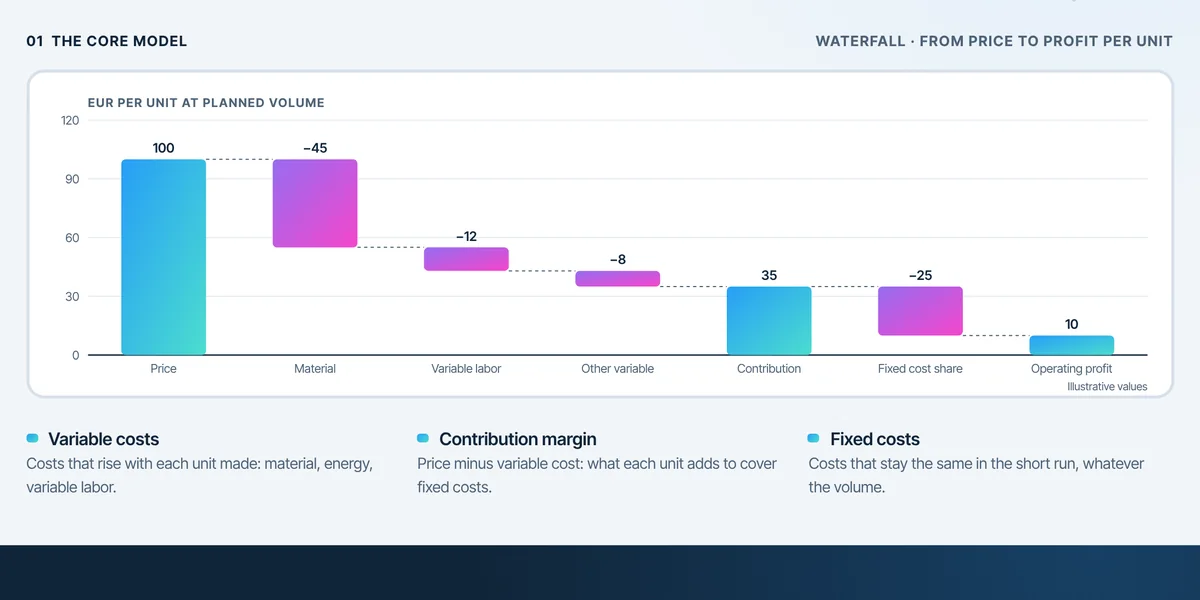
Contribution margin is revenue minus variable costs: what each unit contributes to fixed costs and profit.
 Strategy & Performance
Break-Even Analysis
Break-even analysis finds the volume at which revenue exactly covers fixed and variable costs.
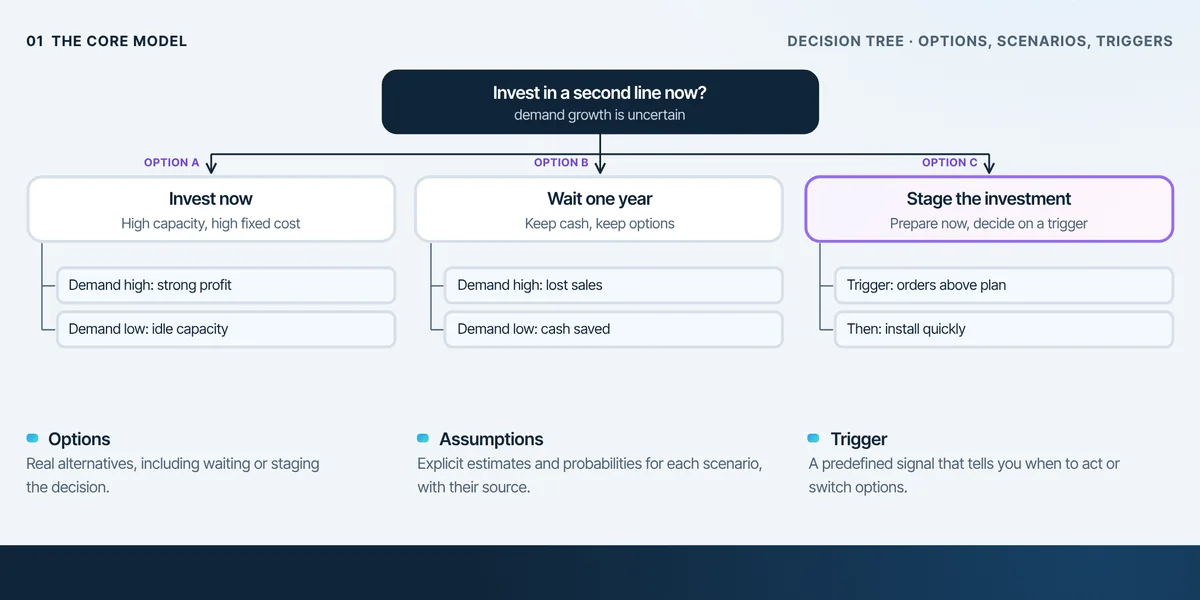 Strategy & Performance
Decision-Making Under Uncertainty
Decision-making under uncertainty compares options across several possible futures, makes assumptions explicit and sets triggers that tell you when to act or change course.
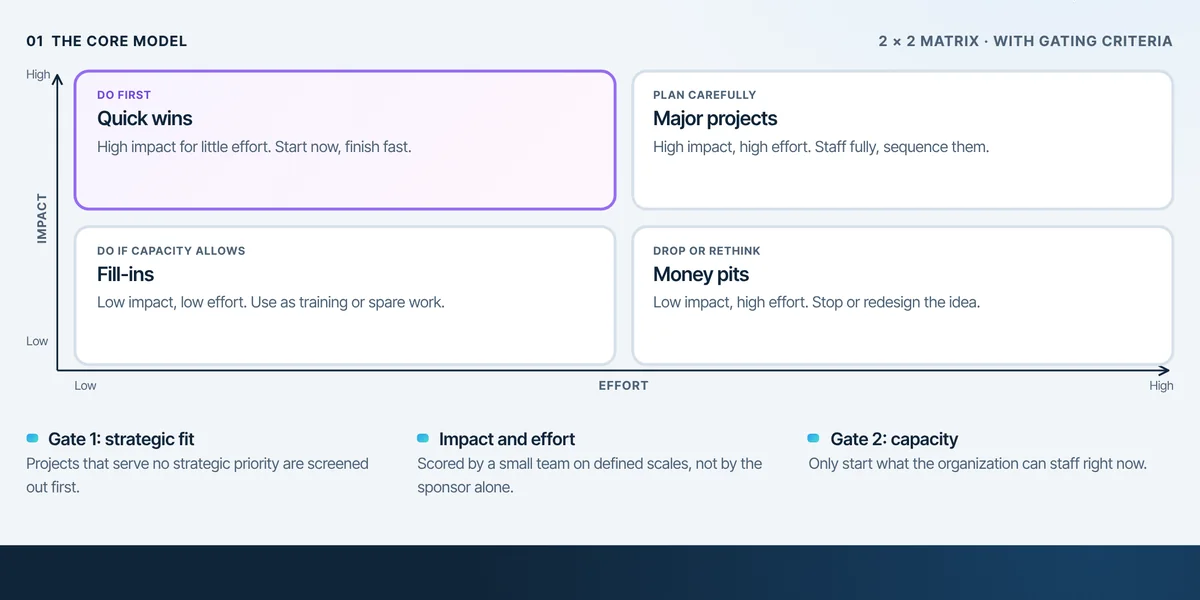 Strategy & Performance
Portfolio Prioritization Matrix
A portfolio prioritization matrix scores candidate projects on impact and effort, after screening for strategic fit, and starts only what the organization has capacity to deliver.
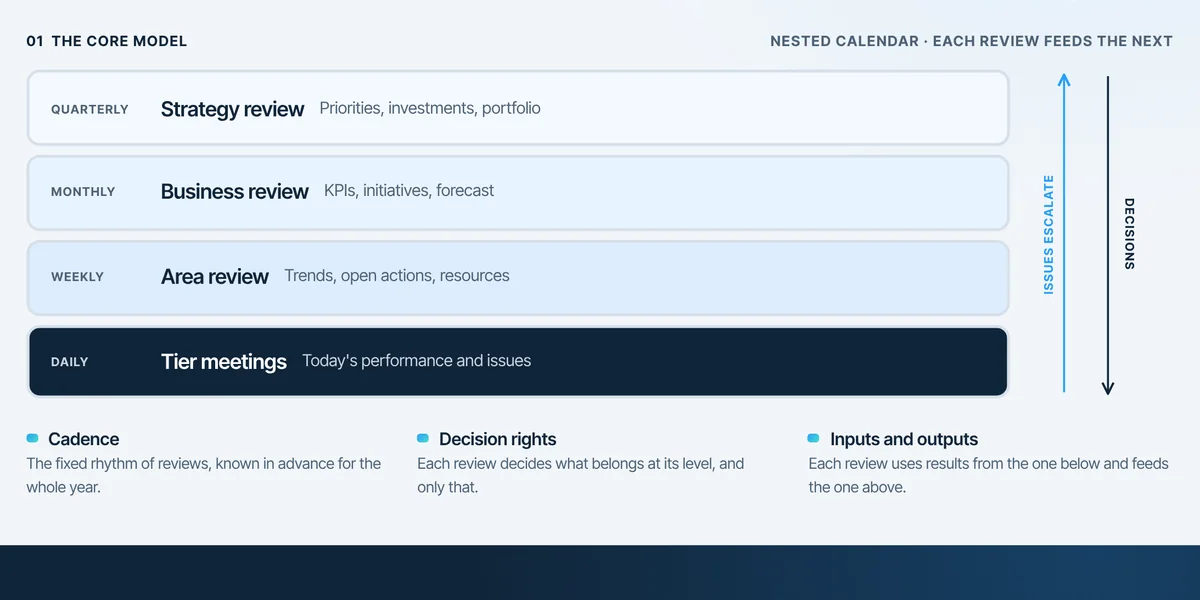 Strategy & Performance
Operating Review Cadence
An operating review cadence is a nested set of daily, weekly, monthly and quarterly reviews, each with a clear purpose, inputs and decision rights.
 Digital Operations
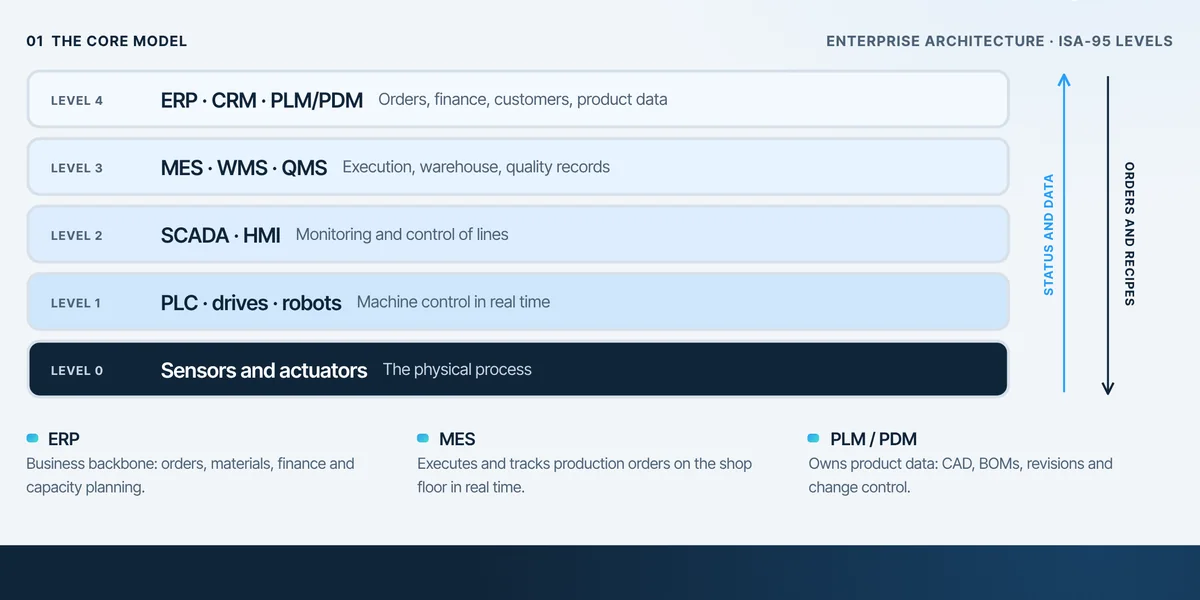
The Industrial Systems Landscape
The industrial systems landscape is the set of software layers that run a manufacturing business, from ERP, CRM and PLM at the top to MES, WMS and the controls on the shop floor.
 Digital Operations
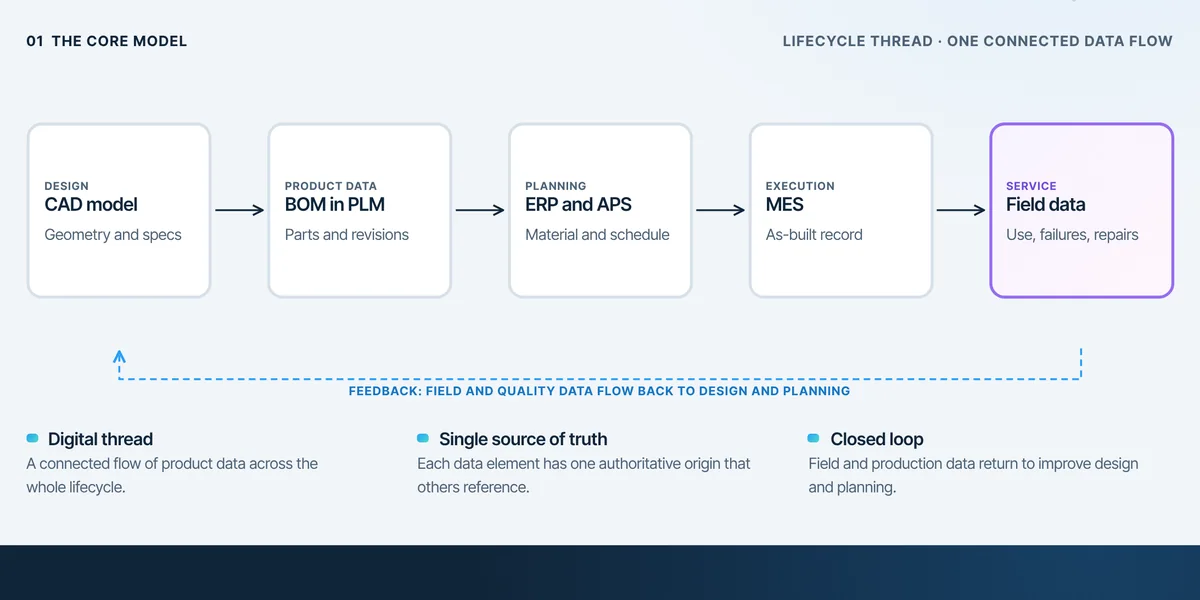
Digital Thread from Design to Service
A digital thread connects product data across the lifecycle, from CAD and BOM through planning and production to service, so each stage works from the same, current information.
 Digital Operations
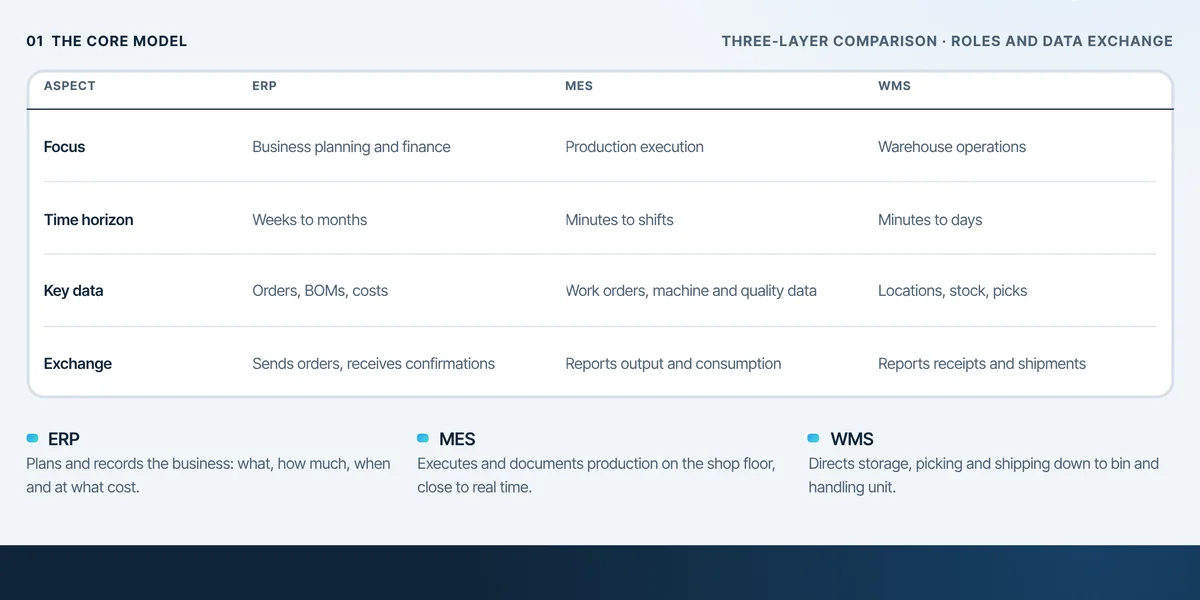
ERP vs MES vs WMS
ERP plans and records the business, MES runs and documents production on the shop floor, and WMS directs storage and movement in the warehouse.
 Digital Operations
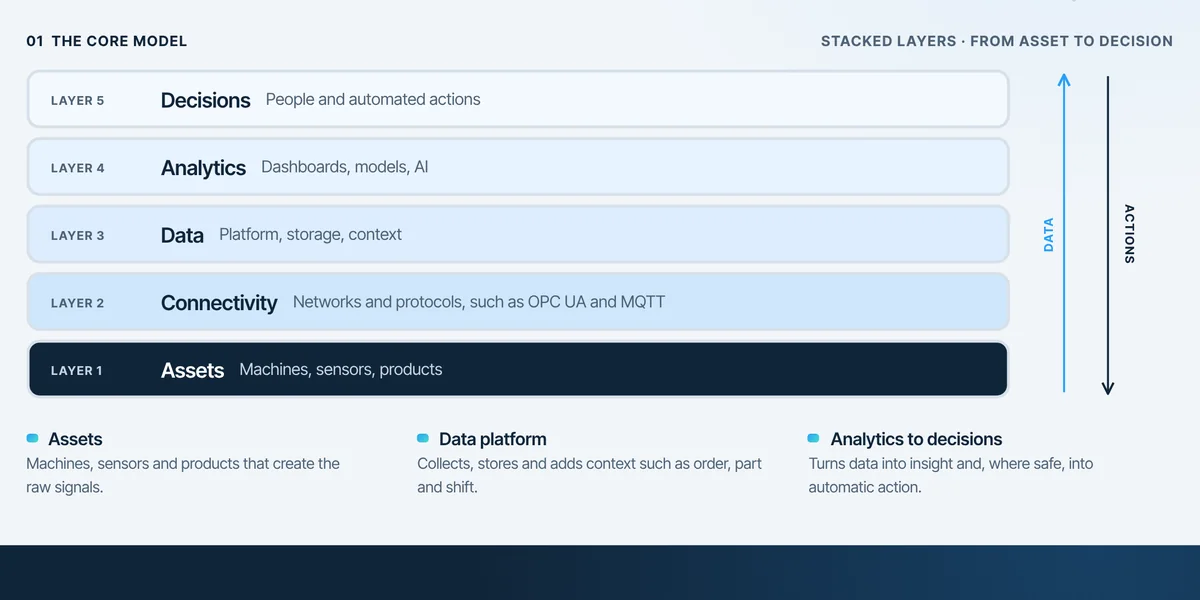
Industry 4.0 Reference Architecture
An Industry 4.0 reference architecture stacks the layers needed to turn machine signals into better decisions: assets, connectivity, data, analytics and the decisions themselves.
 Digital Operations
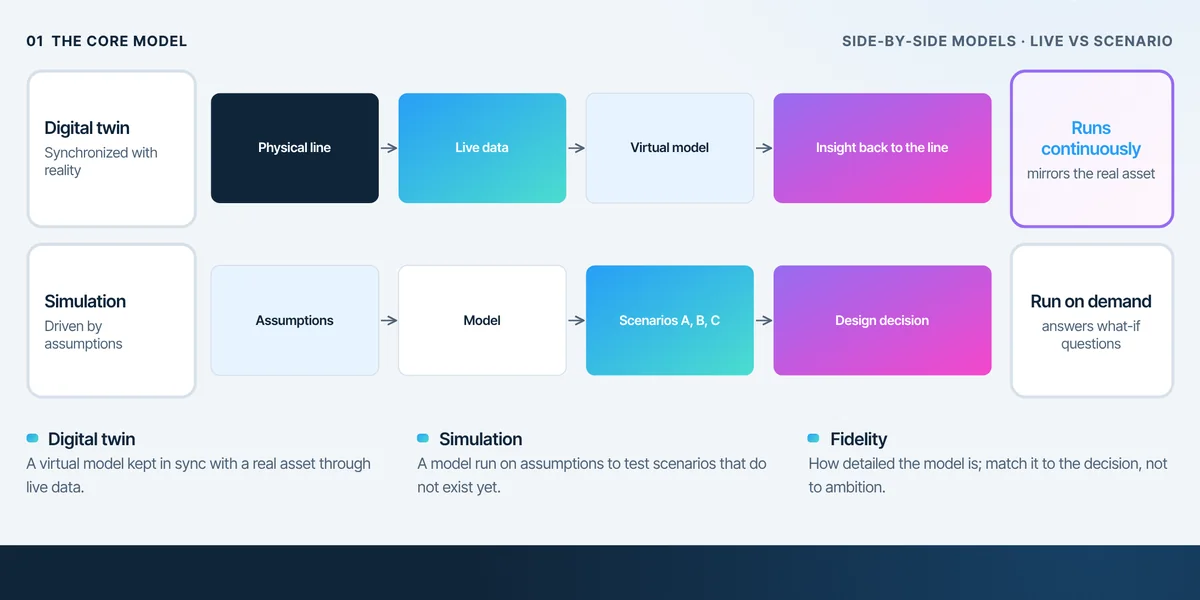
Digital Twin vs Simulation
A digital twin mirrors a real asset through live data, while a simulation explores scenarios based on assumptions.
 Digital Operations
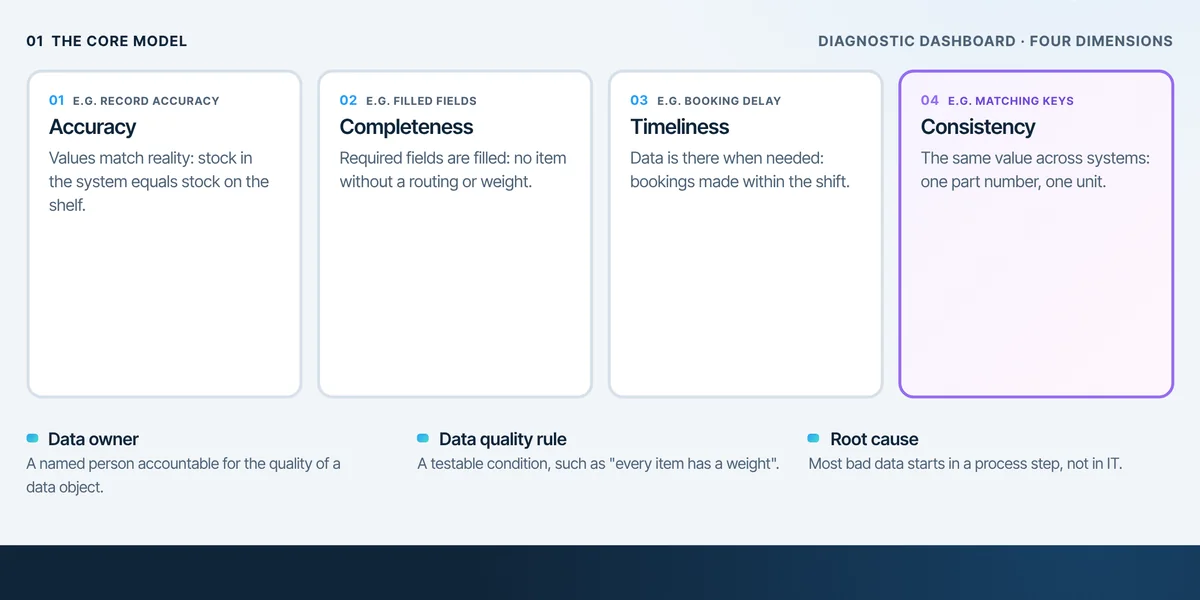
Data Quality in Operations
Data quality describes whether operational data is fit for use: accurate, complete, timely and consistent enough to plan, execute and improve with confidence.
 Digital Operations
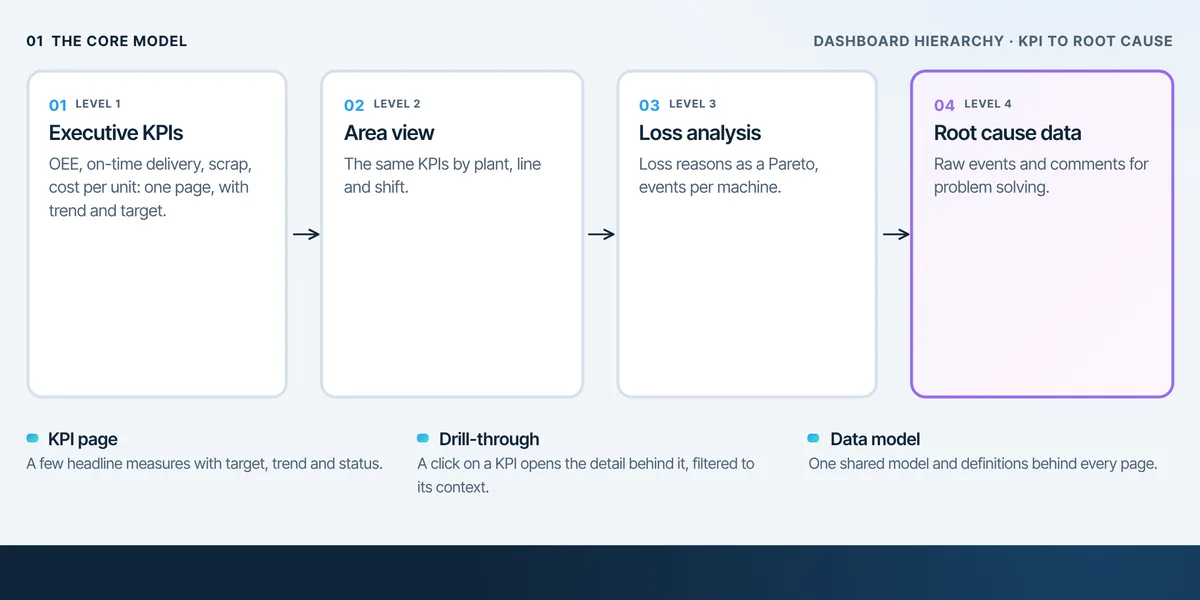
Power BI Operations Dashboard
An operations dashboard in Power BI guides users from a few headline KPIs down through area views and loss analysis to the raw events behind a problem.
 Digital Operations
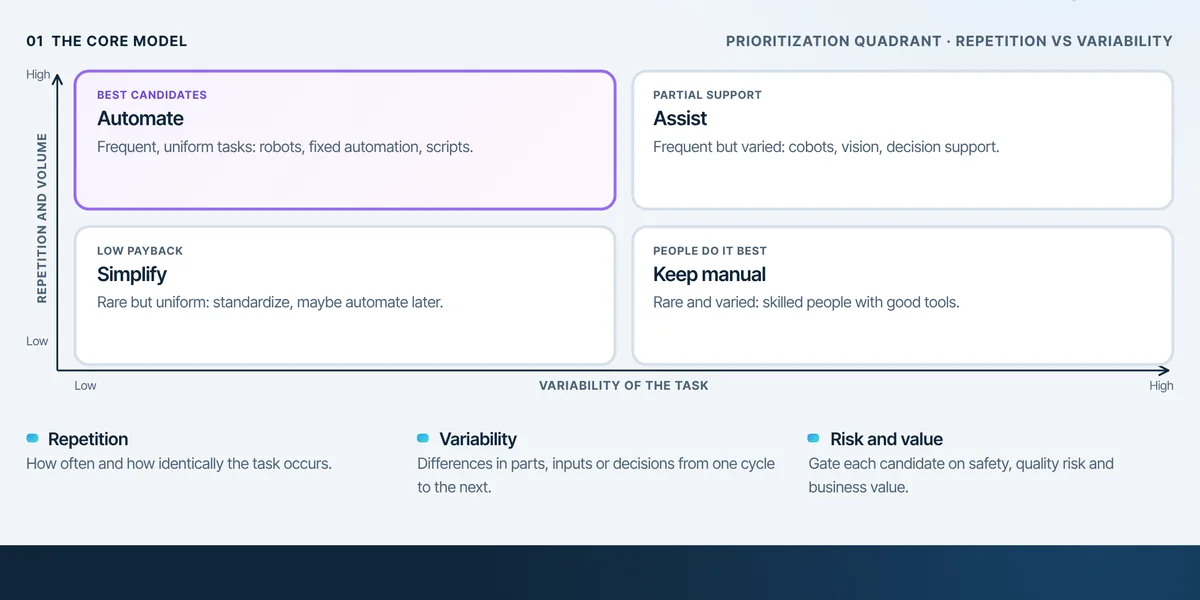
Automation Opportunity Matrix
An automation opportunity matrix rates tasks by how repetitive and how variable they are, then checks risk and value, to show where automation pays and where it does not.
 Digital Operations
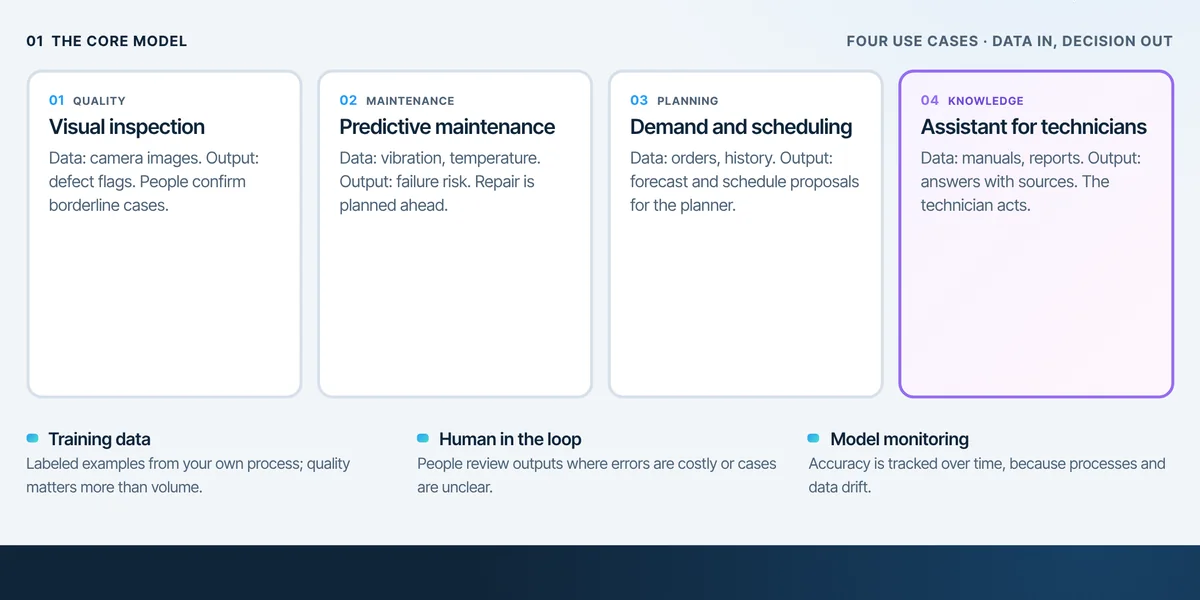
AI Use Cases in Manufacturing
AI in manufacturing uses data-driven models to support decisions in inspection, maintenance, planning and knowledge work, ideally with people reviewing the outputs that matter.
 Digital Operations
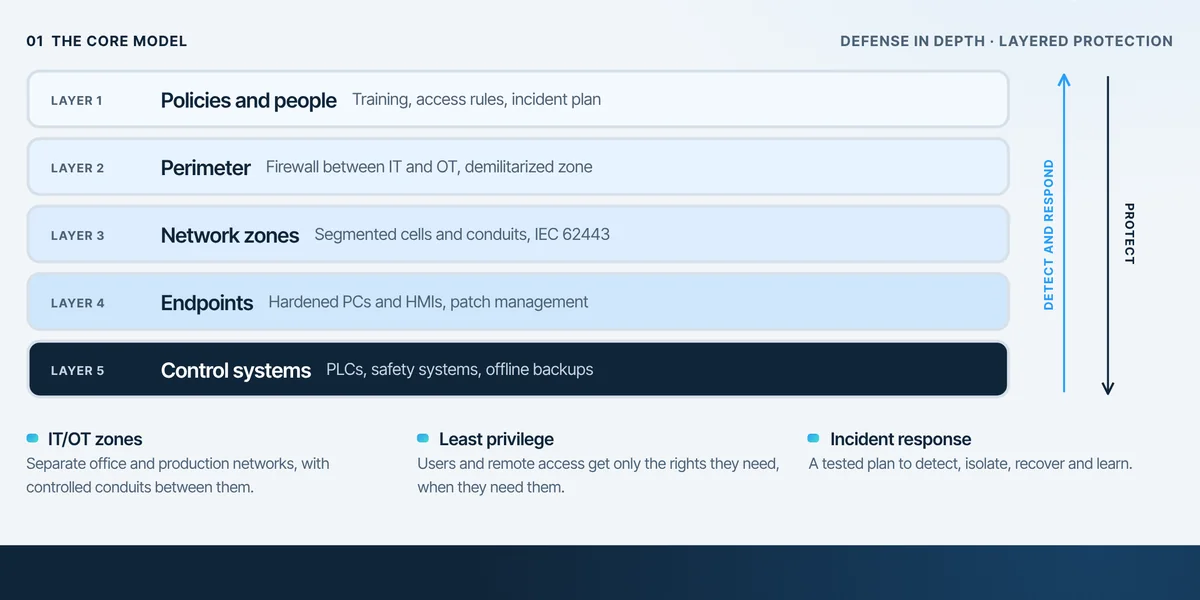
Cybersecurity for Industrial Operations
Industrial cybersecurity protects production systems with several layers of defense, separating IT and OT, controlling access and preparing to detect and recover from incidents.
 Change & Transformation
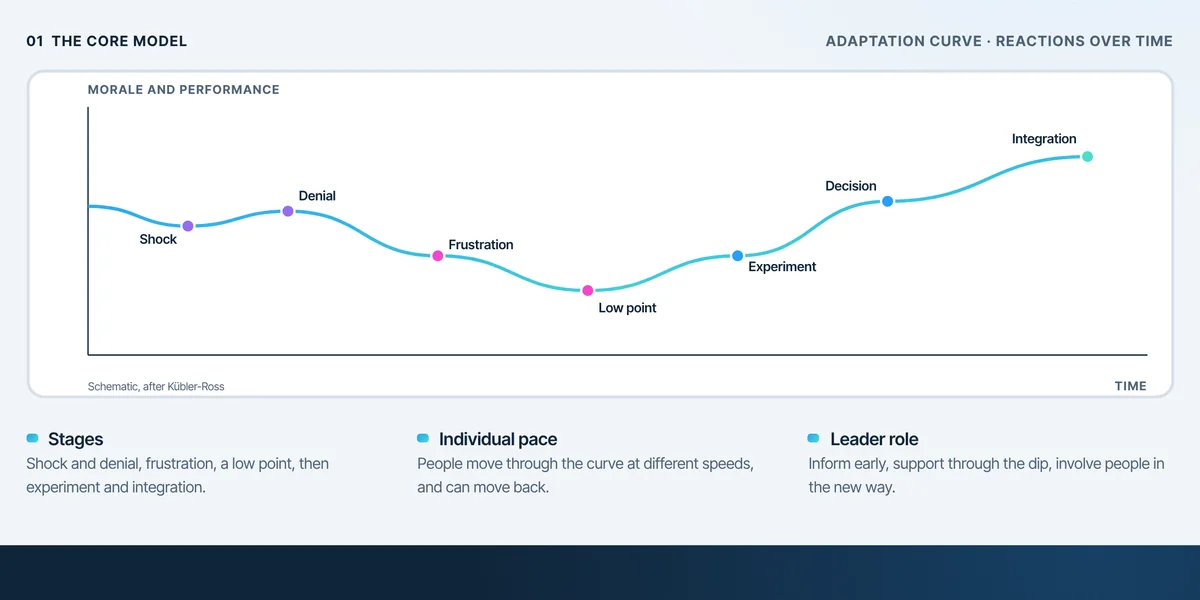
The Change Curve
The change curve describes how people typically react to a significant change over time: from shock and resistance through a low point to experimenting and integration.
 Change & Transformation
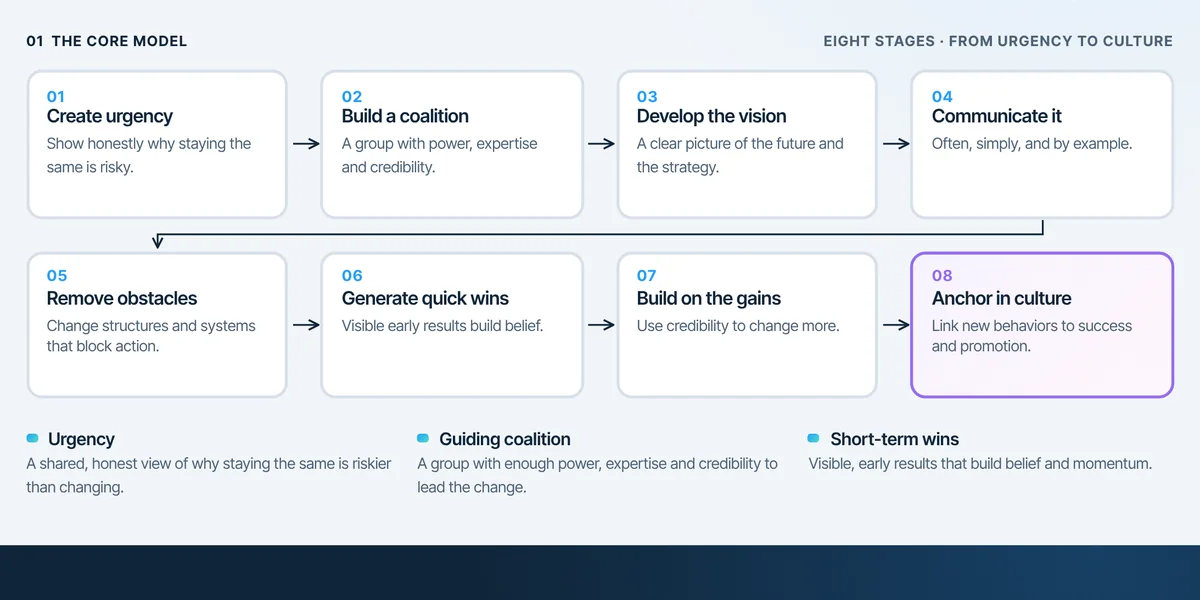
Kotter's Eight-Step Change Model
John Kotter's model describes eight stages that successful organizational changes go through, from creating urgency to anchoring new approaches in the culture.
 Change & Transformation
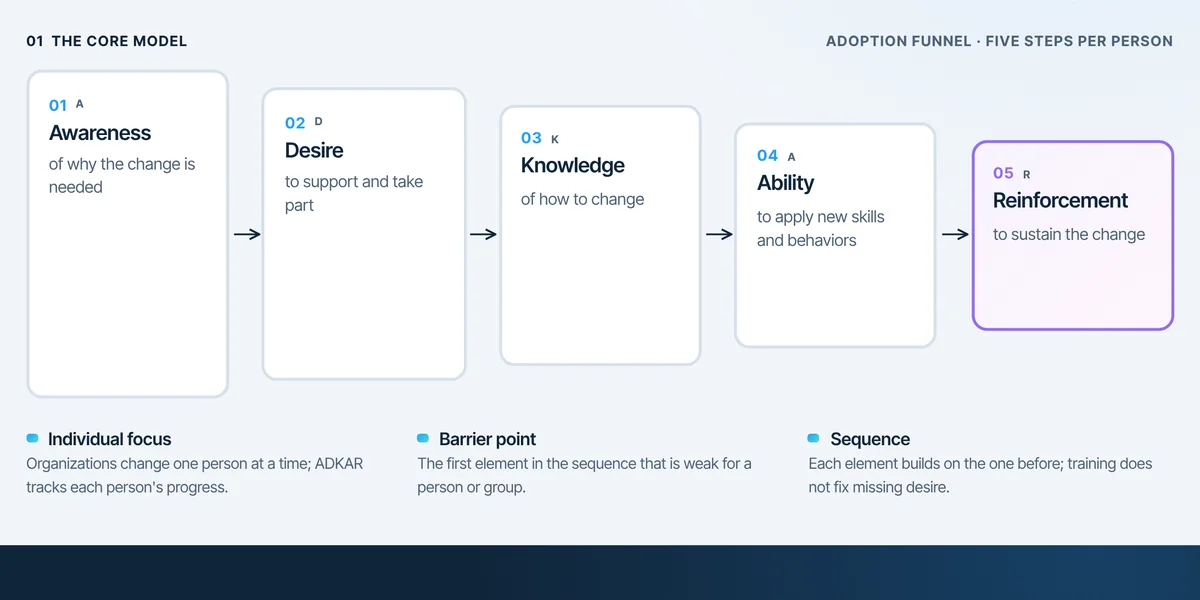
ADKAR Change Management
ADKAR is a model of individual change: a person needs Awareness, Desire, Knowledge, Ability and Reinforcement, in that order, for a change to stick.
 Change & Transformation
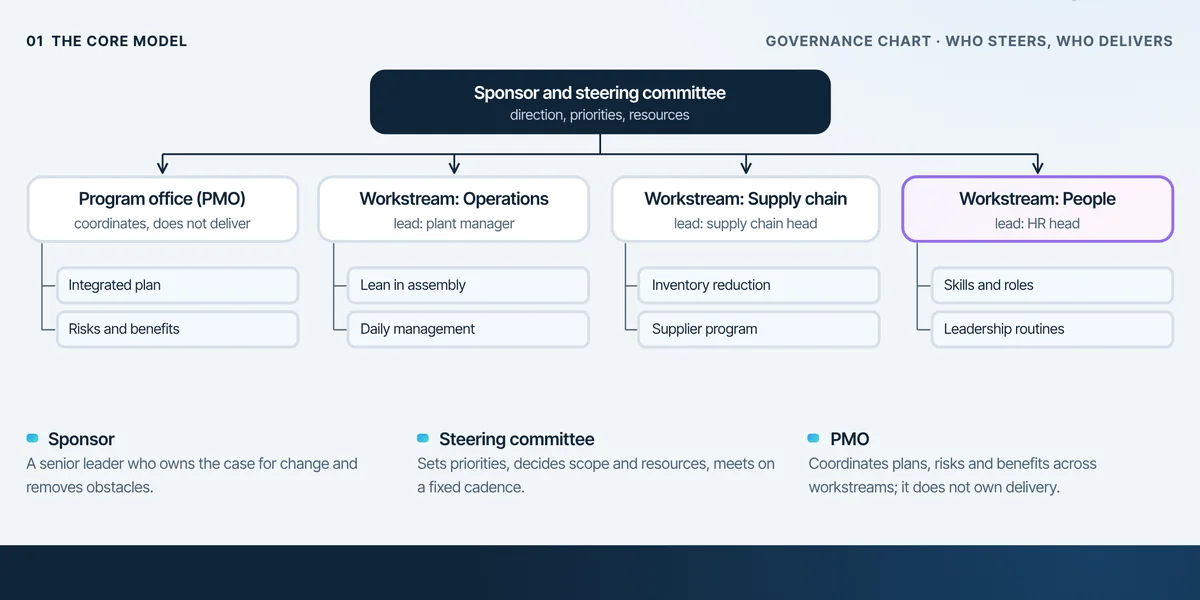
Transformation Governance
Transformation governance defines who steers a change program and how: sponsor, steering committee, program office and workstreams, each with clear decision rights.
 Change & Transformation
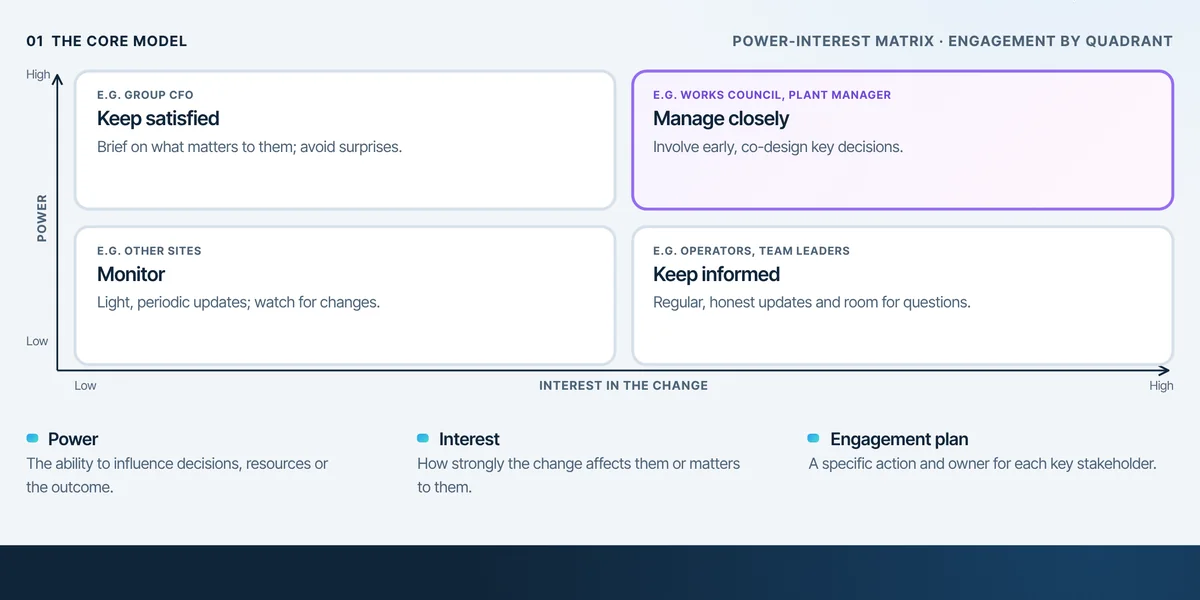
Stakeholder Mapping
Stakeholder mapping places the people and groups affected by a change on a grid of power and interest, so each gets the right level and kind of engagement.
 Change & Transformation
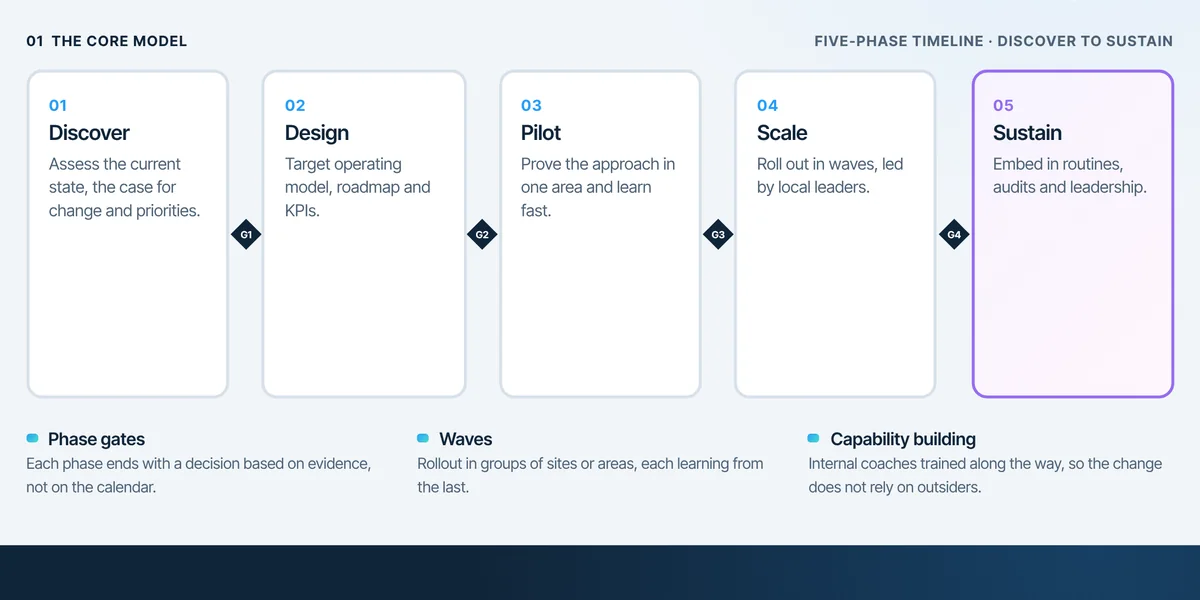
Transformation Roadmap
A transformation roadmap sequences a large change into phases, typically discover, design, pilot, scale and sustain, with evidence-based decisions between them.
 Change & Transformation
Pilot to Scale
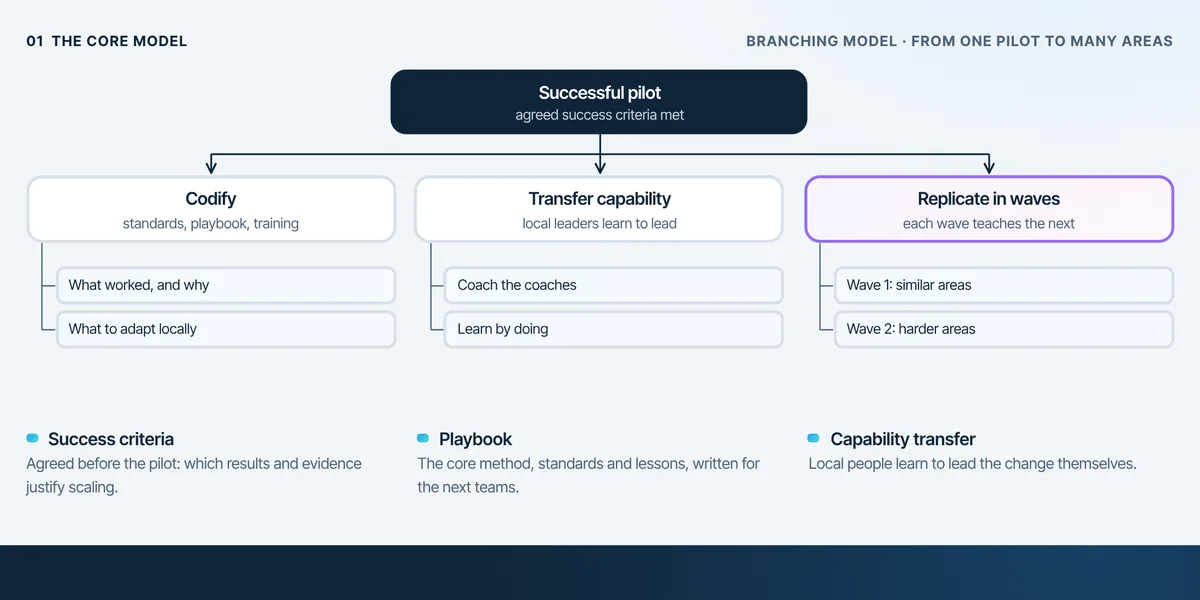
Pilot to scale is the step from one successful trial to broad rollout: proving success criteria, codifying what worked, transferring capability and replicating in waves.
 Change & Transformation
Change Resistance Diagnostics
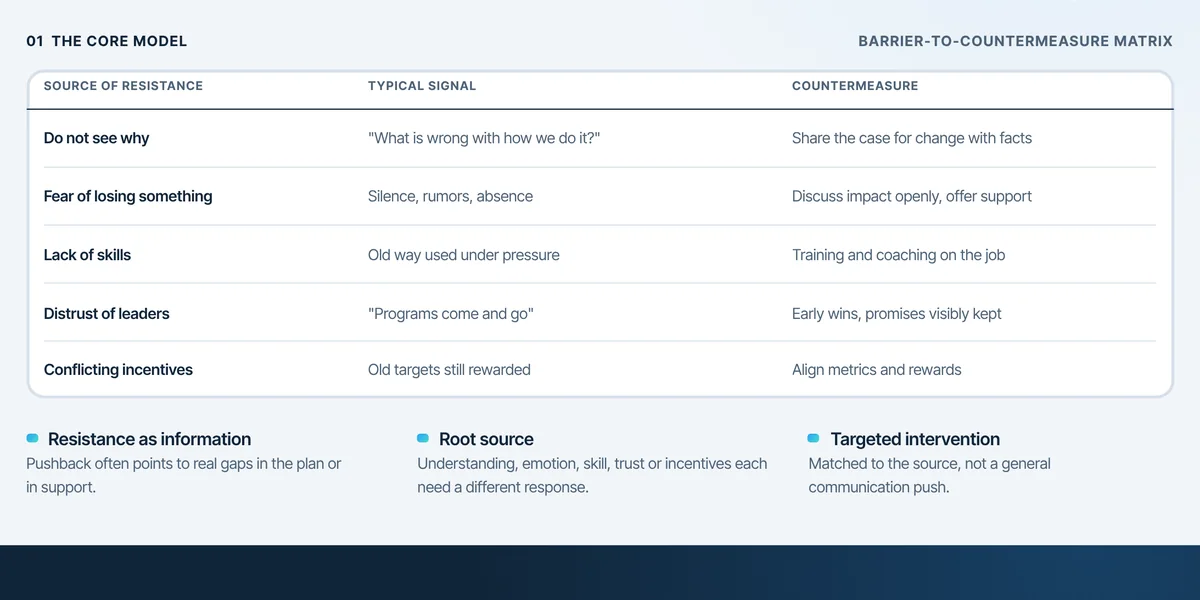
Change resistance diagnostics identify why people push back, whether understanding, fear, skills, trust or incentives, so the response can target the real source.
 Change & Transformation
Benefits Realization Tracking
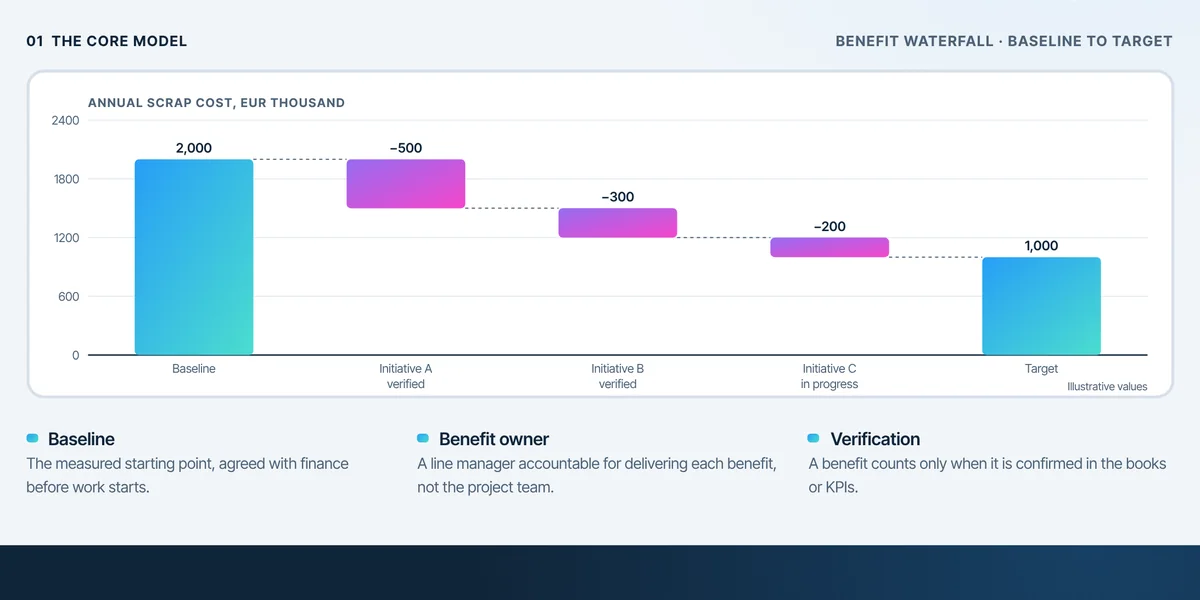
Benefits realization tracking follows each promised benefit from an agreed baseline to a target, with a named owner, until it is verified in the books or KPIs.
 Change & Transformation
Sustaining Transformation
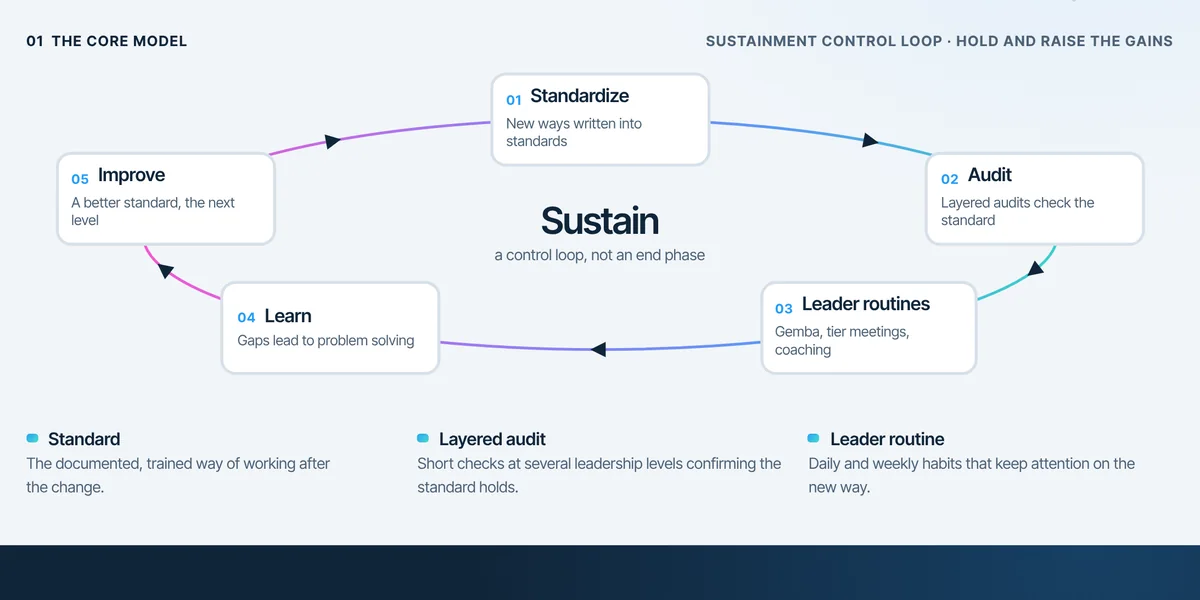
Sustaining a transformation means keeping and raising the gains after the program ends, through standards, audits, leader routines and continuous learning.
No print found. Try a shorter word or another category.