Prints | Quality Management
SPC and Control Charts
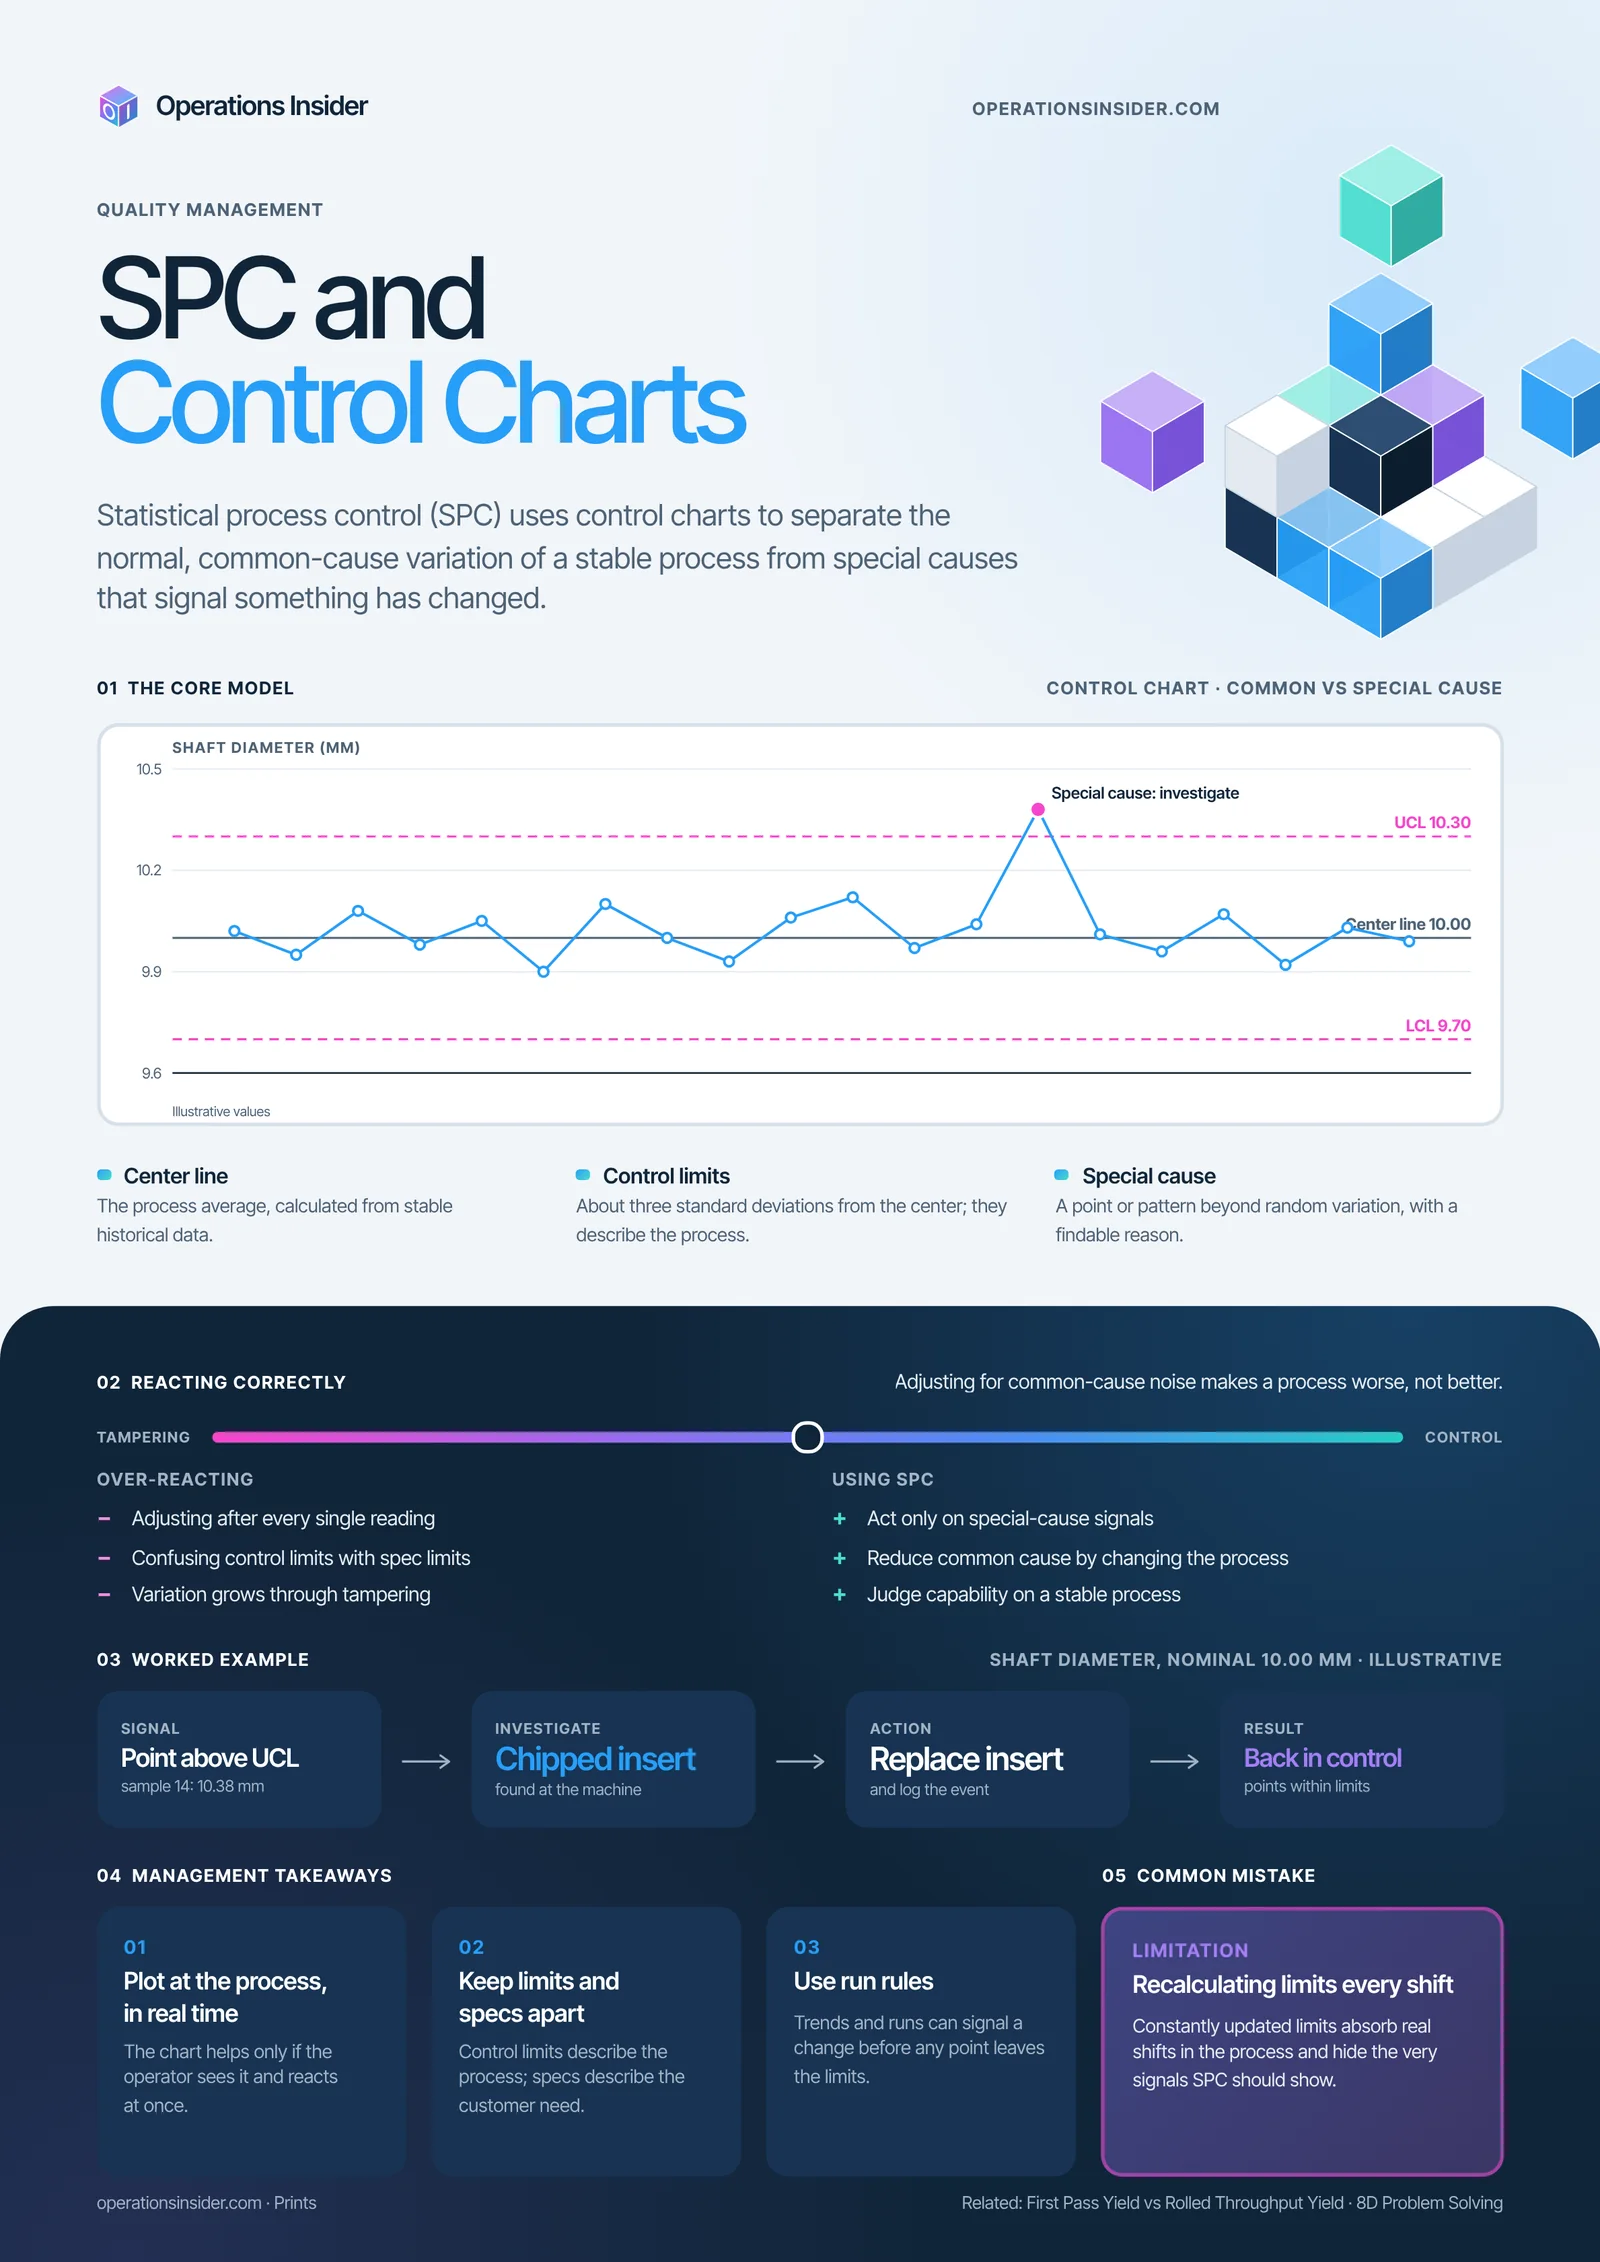
Statistical process control (SPC) uses control charts to separate the normal, common-cause variation of a stable process from special causes that signal something has changed.
What it explains
Statistical process control (SPC) uses control charts to separate the normal, common-cause variation of a stable process from special causes that signal something has changed.
Printing tips
- The PDF is a vector file at DIN A0 (841 × 1189 mm). It stays sharp when printed at A1, A2 or A3.
- Choose "fit to page" in your print dialog for smaller paper sizes.
- Matte paper reduces glare under shop-floor lighting.