Prints | Change & Transformation
The Change Curve
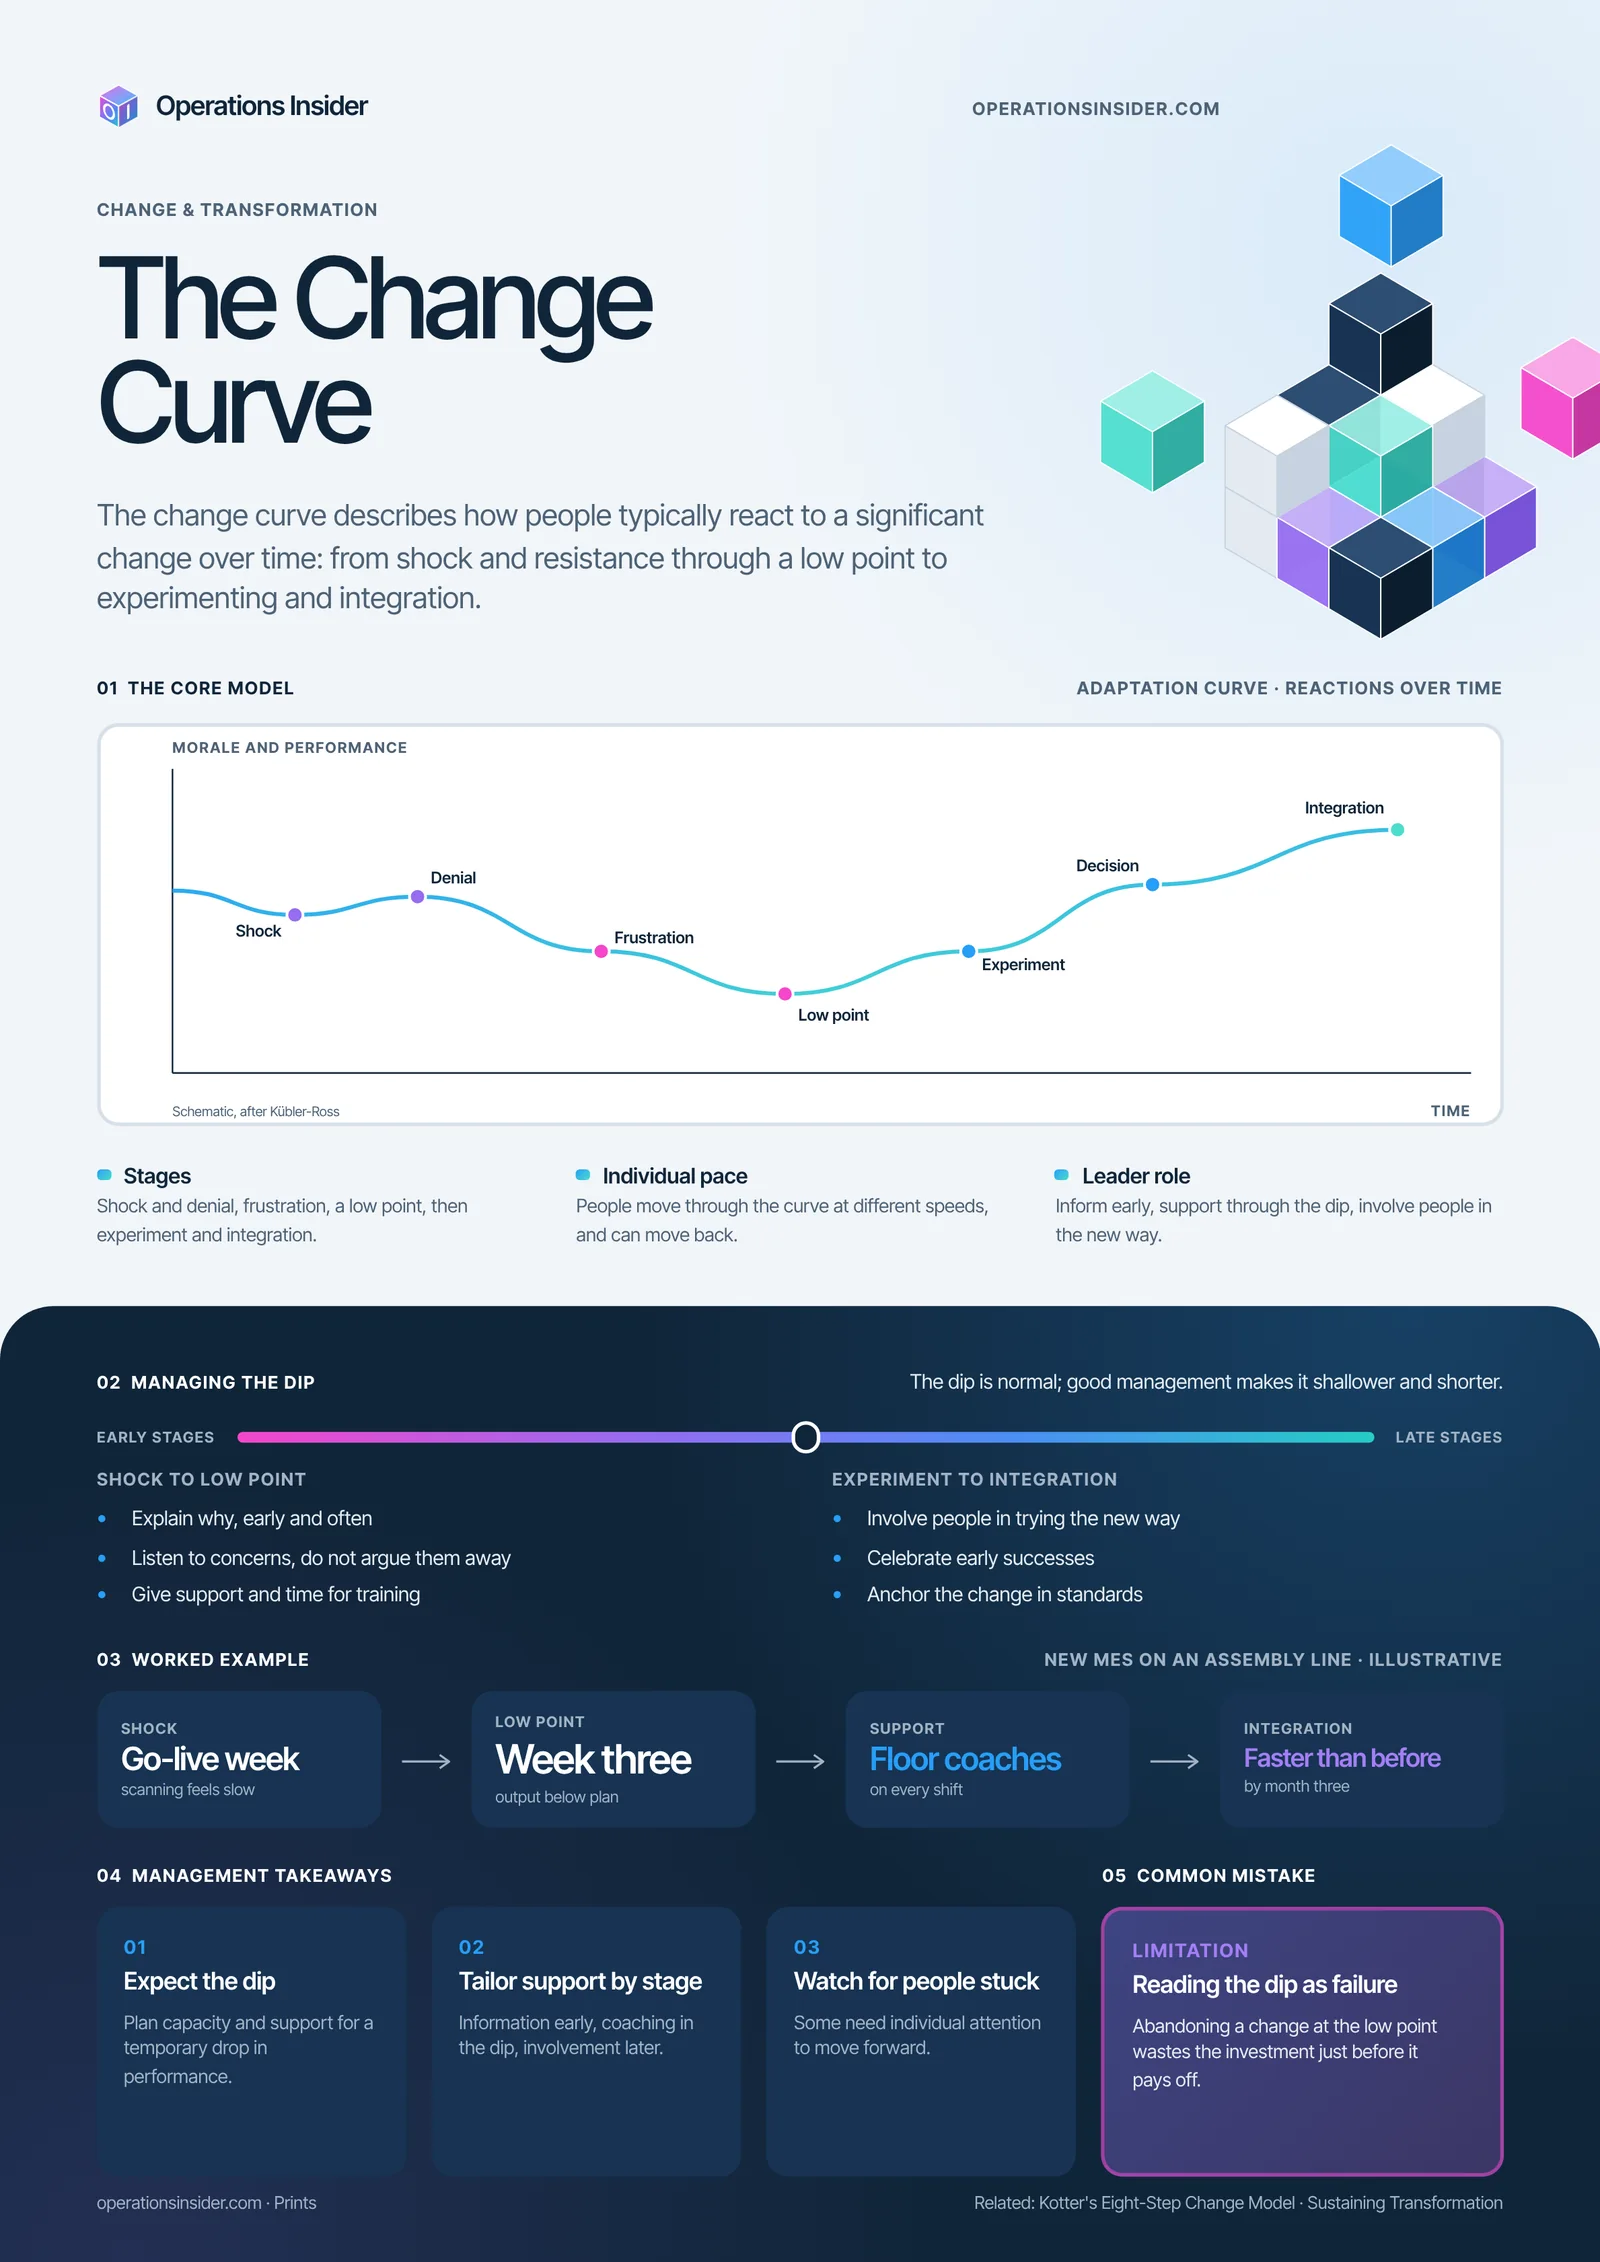
The change curve describes how people typically react to a significant change over time: from shock and resistance through a low point to experimenting and integration.
What it explains
The change curve describes how people typically react to a significant change over time: from shock and resistance through a low point to experimenting and integration.
Printing tips
- The PDF is a vector file at DIN A0 (841 × 1189 mm). It stays sharp when printed at A1, A2 or A3.
- Choose "fit to page" in your print dialog for smaller paper sizes.
- Matte paper reduces glare under shop-floor lighting.